Analyze TxDoT Crash Data for 10th and 12th (and neighboring) Streets
Mapping
Supporting Activism
Harris county
Take a look at the crash data for 10th and 12th streets (and other nearby side streets) in the Houston Heights
Author
Alan Jackson
Published
April 17, 2025
10th and 12th Street Crash Data (really 7th-15th)
11th street in the Houston Heights was reduced from 4 lanes to two, with the addition of protected bicycle lanes, between October 2022 and January 2023. The primary goal was to calm the traffic on 11th and get people to drive the speed limit as it had become quite dangerous.
The portion of the street that was re-engineered went from the intersection at Shepherd east to the end of the street at Michaux.
It has been suggested that the lane reduction has caused people to detour onto 10th and 12th streets, making them more dangerous. Note that 10th and 12th only run usefully from Shepherd to Studewood, so this will be a smaller dataset, and possibly statistically compromised.
Additionally, to help act as controls I will look at a number of streets to the north and south of 11th, even though to the south they are not good detours. So I will add 7th, 8th, 9th, 13th, 14th, and 15th.
Let’s pull out the streets and do some data cleanup
There are some obvious typos in the street names and block numbers, which I will correct.
Tenth street is odd - the field Street_Name has 411 entries for 10th street, but the field Rpt_Street_Name has 58 entries. To help eliminate the incorrect records, I will use the latitude and longitude supplied to help constrain which records get included. In particular, there are 5 records which have 22nd street as the Street_Name, but 10th street as the Rpt_Street_Name. Those 5 records have a latitude consistent with 22nd street, so I will drop them. I just wish I understood how the values all get assigned.
Code
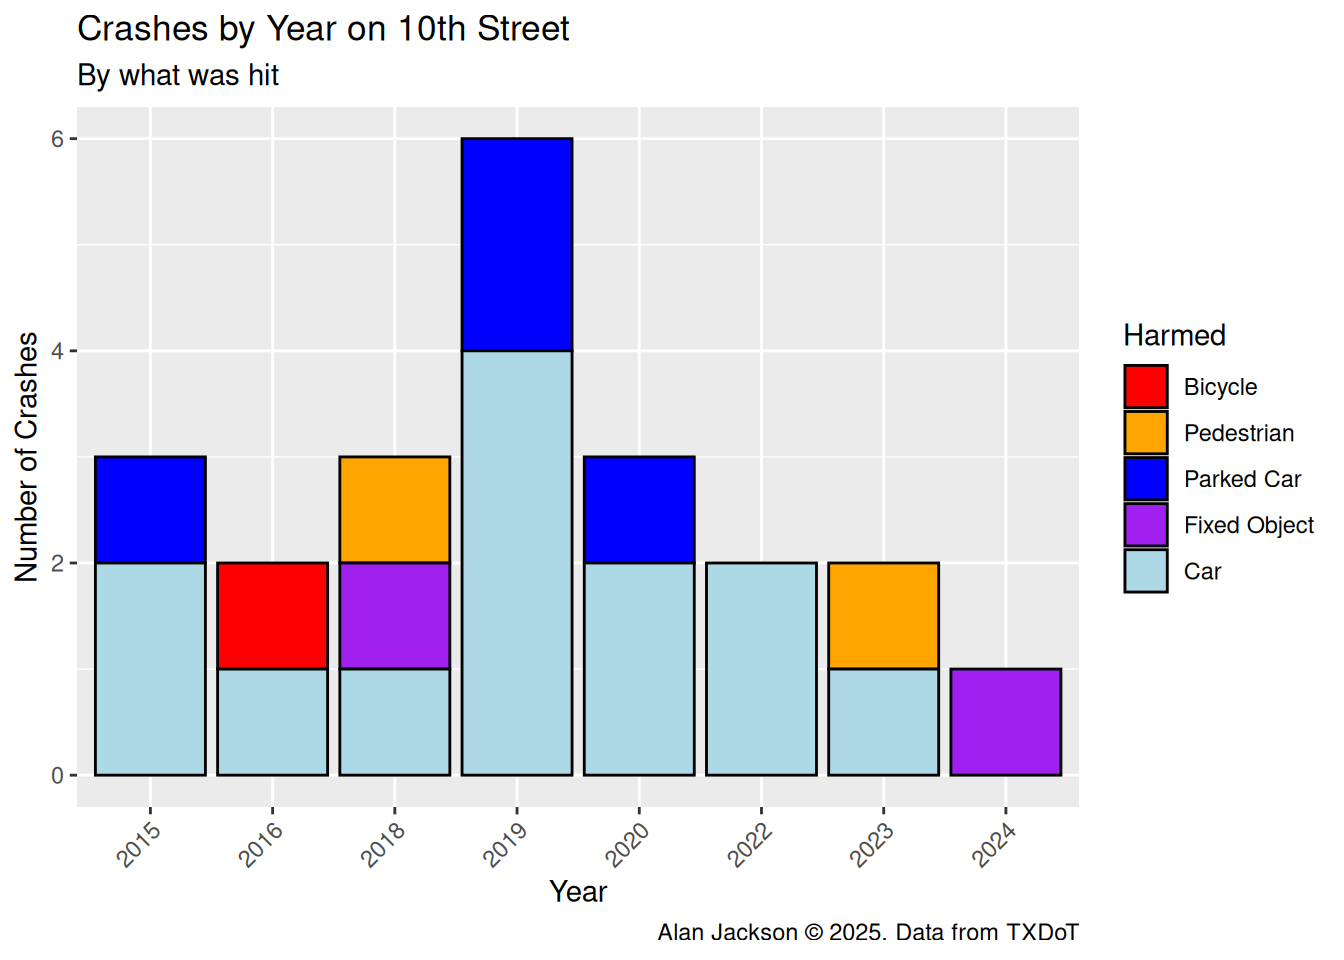
# Pull out 10th street and do some cleanupTenth <- df %>%filter(City=="Houston") %>%filter(stringr::str_detect(Rpt_Street_Name, "10 ?TH")) %>%mutate(Rpt_Street_Name=stringr::str_remove(Rpt_Street_Name, "E | ST| 12| ")) %>%mutate(Severity=factor(Severity, levels=c("NOT INJURED", "POSSIBLE INJURY","NON-INCAPACITATING", "SUSPECTED SERIOUS INJURY","FATAL", "UNKNOWN"))) %>%mutate(Harmed=factor(Harmed, levels=c("Motor Vehicle in Transport","Fixed Object", "Parked Car","Pedestrian", "Pedal Cyclist","Overturned", "Other Object", "Animal","Other Non-Collision", "Rail Road"))) # One record has no lat/long, so I will add it by handTenth[Tenth$Crash_ID=="17607085",]$Latitude <-"29.78889679"Tenth[Tenth$Crash_ID=="17607085",]$Longitude <-"-95.39610723"# Filter out by latitudeTenth <- Tenth %>%filter(between(as.numeric(Latitude), 29.783, 29.790))Tenth <- Tenth %>%mutate(Lat=as.numeric(Latitude)) %>%mutate(Lon=as.numeric(Longitude)) # Make plot Harm_plot(Tenth, "10th")
Now for 12th street
12th is much better behaved, there is one record where the street names are 12th and 24th (Latitude matches 24th), and one record where the street names are 12th and IH0610 (Latitude indicates it is where 12th intersects IH610 west). Since there is a segment of 12th west of Shepherd, I will drop those records as well.
Code
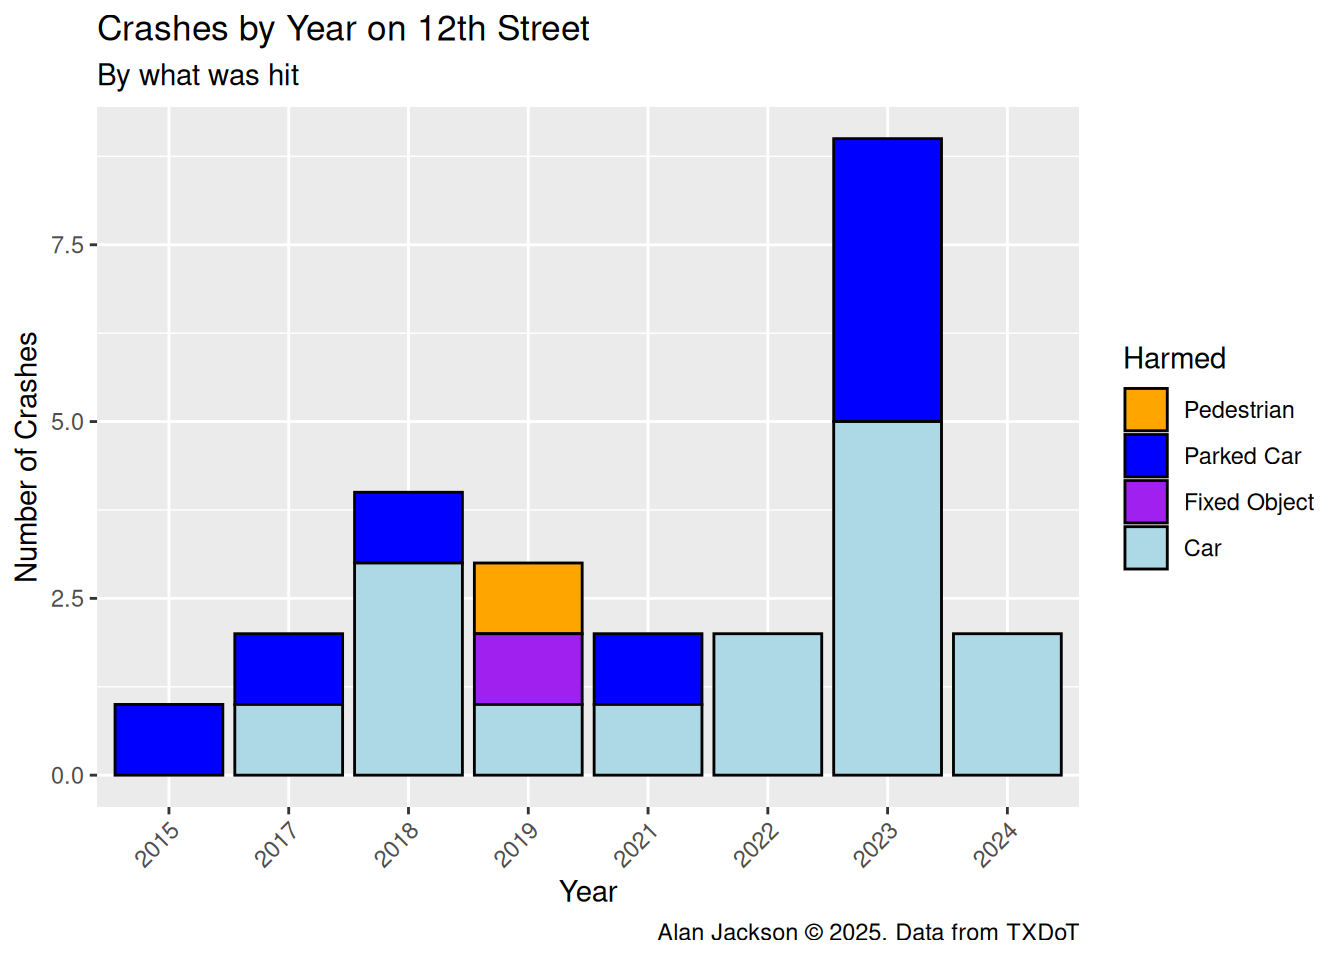
# Pull out 12th street and do some cleanupTwelfth <- df %>%filter(City=="Houston") %>%filter(stringr::str_detect(Rpt_Street_Name, "12 ?TH")) %>%mutate(Rpt_Street_Name=stringr::str_remove(Rpt_Street_Name, "E | ST| 12| ")) %>%mutate(Severity=factor(Severity, levels=c("NOT INJURED", "POSSIBLE INJURY","NON-INCAPACITATING", "SUSPECTED SERIOUS INJURY","FATAL", "UNKNOWN"))) %>%mutate(Harmed=factor(Harmed, levels=c("Motor Vehicle in Transport","Fixed Object", "Parked Car","Pedestrian", "Pedal Cyclist","Overturned", "Other Object", "Animal","Other Non-Collision", "Rail Road"))) %>%# Get some of the missing block numbersmutate(Rpt_Block_Num=if_else(is.na(Rpt_Block_Num), as.character(100*as.integer(as.numeric(Street_Nbr)/100)), Rpt_Block_Num))# Three records have no lat/long, so I will add them by handAdd_coord <-tribble(~Crash_ID, ~Latitude, ~Longitude,"15770442", "29.79265503", "-95.388926","19408770", "29.79163907", "-95.4385921","20102795", "29.79163907", "-95.4385921" )for (i in1:3) { Twelfth[Twelfth$Crash_ID==Add_coord[i,]$Crash_ID,]$Latitude <- Add_coord[i,]$Latitude Twelfth[Twelfth$Crash_ID==Add_coord[i,]$Crash_ID,]$Longitude <- Add_coord[i,]$Longitude}# Filter out by latitudeTwelfth <- Twelfth %>%filter(between(as.numeric(Latitude), 29.791, 29.793))# Filter out by longitudeTwelfth <- Twelfth %>%filter(between(as.numeric(Longitude), -95.4099, -95.3877))Twelfth <- Twelfth %>%mutate(Lat=as.numeric(Latitude)) %>%mutate(Lon=as.numeric(Longitude)) # Make plot Harm_plot(Twelfth, "12th")
7th street
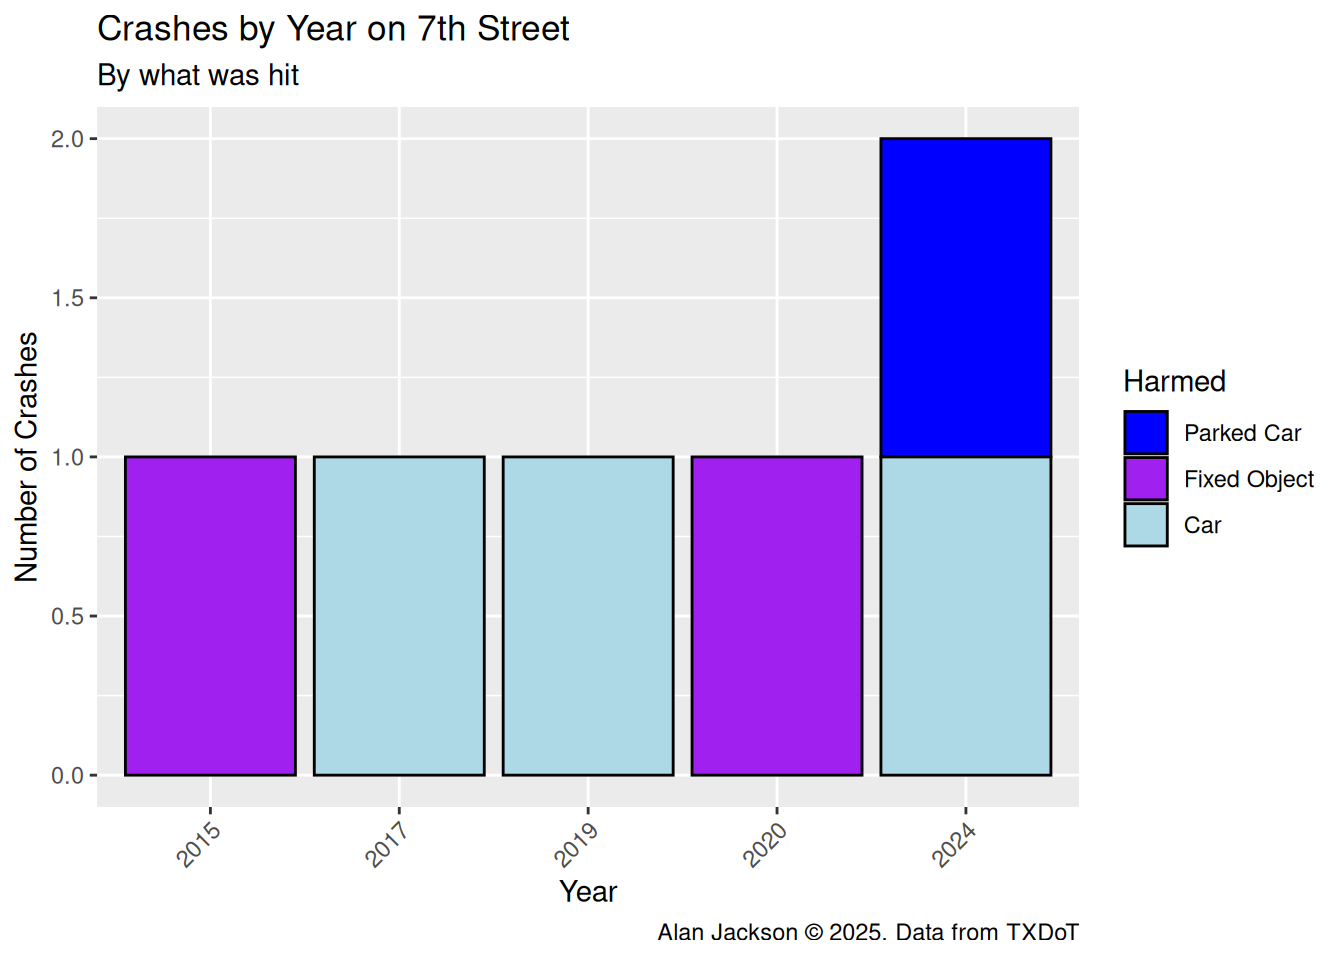
There is a 7th street in Alief, but those street numbers are in the 12,000’s, so they are easy to eliminate. There were 3 addresses that were apparently actually on 20th street, and one address where I had to manually add the lat/long.
Code
# Pull out 7th street and do some cleanupSeventh <- df %>%filter(City=="Houston") %>%filter(stringr::str_detect(Rpt_Street_Name, "^7 ?TH")) %>%mutate(Rpt_Street_Name=stringr::str_remove(Rpt_Street_Name, "E | ST| 12| ")) %>%filter(as.integer(Rpt_Block_Num) <2000) %>%mutate(Severity=factor(Severity, levels=c("NOT INJURED", "POSSIBLE INJURY","NON-INCAPACITATING", "SUSPECTED SERIOUS INJURY","FATAL", "UNKNOWN"))) %>%mutate(Harmed=factor(Harmed, levels=c("Motor Vehicle in Transport","Fixed Object", "Parked Car","Pedestrian", "Pedal Cyclist","Overturned", "Other Object", "Animal","Other Non-Collision", "Rail Road"))) # one record has no lat/long, so I will add it by handAdd_coord <-tribble(~Crash_ID, ~Latitude, ~Longitude,"20213800", "29.78333080", "-95.3977417" ) Seventh[Seventh$Crash_ID==Add_coord$Crash_ID,]$Latitude <- Add_coord$Latitude Seventh[Seventh$Crash_ID==Add_coord$Crash_ID,]$Longitude <- Add_coord$Longitude# Filter out by latitudeSeventh <- Seventh %>%filter(between(as.numeric(Latitude), 29.782, 29.784))Seventh <- Seventh %>%mutate(Lat=as.numeric(Latitude)) %>%mutate(Lon=as.numeric(Longitude)) # Make plot Harm_plot(Seventh, "7th")
8th street
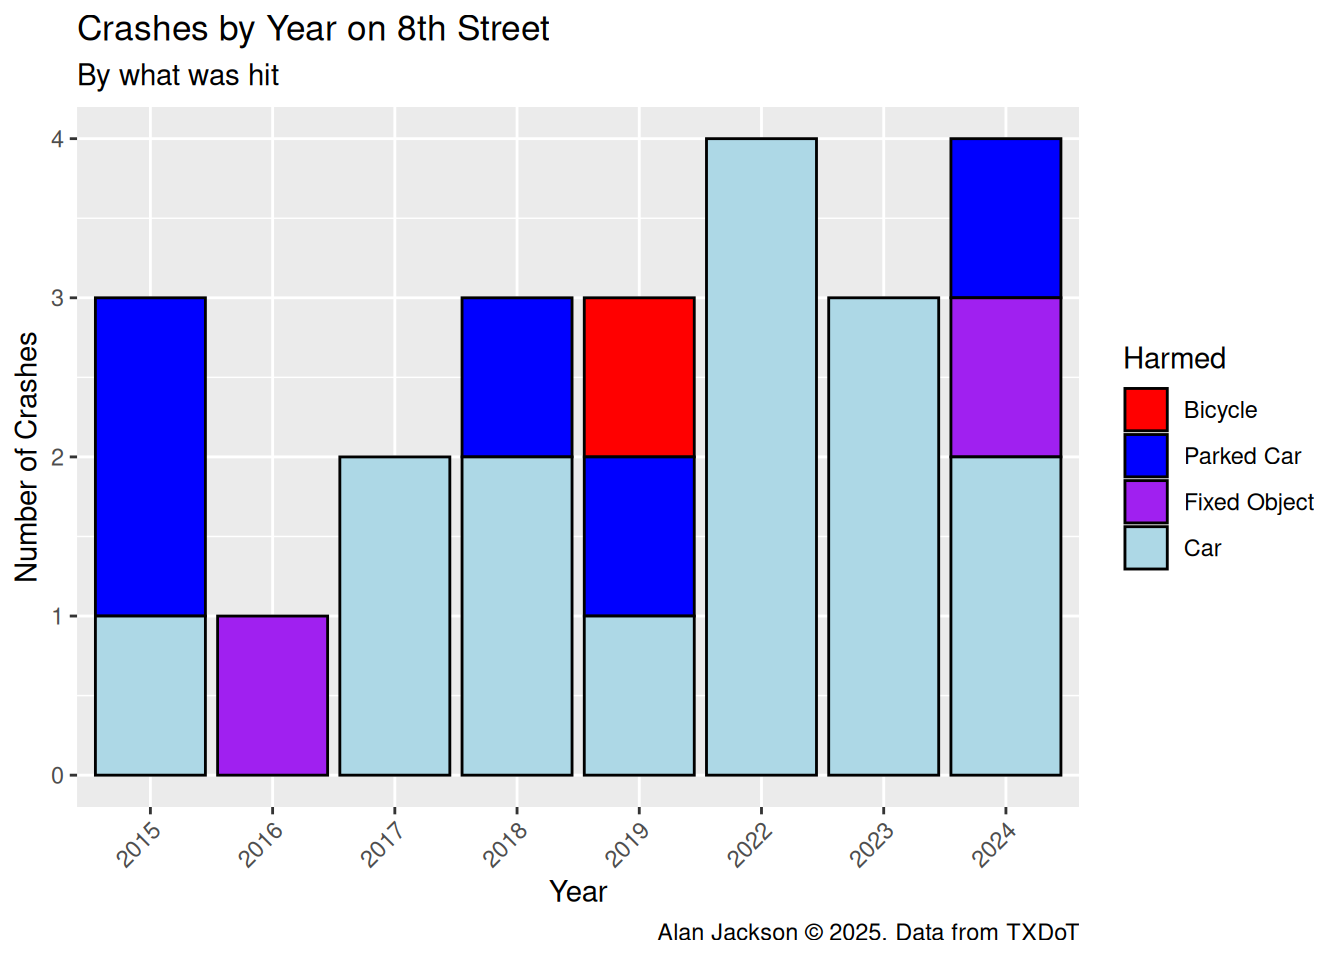
A lot more activity on 8th. Fixed 3 lat/longs, but everything else looked clean.
Code
# Pull out 8th street and do some cleanupEighth <- df %>%filter(City=="Houston") %>%filter(str_detect(Rpt_Street_Name, "^8 ?TH")) %>%mutate(Rpt_Street_Name=str_remove(Rpt_Street_Name, "E | STREET| 12| ")) %>%filter(as.integer(Rpt_Block_Num) <2000) %>%mutate(Severity=factor(Severity, levels=c("NOT INJURED", "POSSIBLE INJURY","NON-INCAPACITATING", "SUSPECTED SERIOUS INJURY","FATAL", "UNKNOWN"))) %>%mutate(Harmed=factor(Harmed, levels=c("Motor Vehicle in Transport","Fixed Object", "Parked Car","Pedestrian", "Pedal Cyclist","Overturned", "Other Object", "Animal","Other Non-Collision", "Rail Road"))) # one record has no lat/long, so I will add it by handAdd_coord <-tribble(~Crash_ID, ~Latitude, ~Longitude,"17491696", "29.7850210", "-95.4067335","20177842", "29.7850210", "-95.4067335","20415261", "29.7850210", "-95.4067335" )for (i in1:3) { Eighth[Eighth$Crash_ID==Add_coord[i,]$Crash_ID,]$Latitude <- Add_coord[i,]$Latitude Eighth[Eighth$Crash_ID==Add_coord[i,]$Crash_ID,]$Longitude <- Add_coord[i,]$Longitude}Eighth <- Eighth %>%mutate(Lat=as.numeric(Latitude)) %>%mutate(Lon=as.numeric(Longitude)) # Make plot Harm_plot(Eighth, "8th")
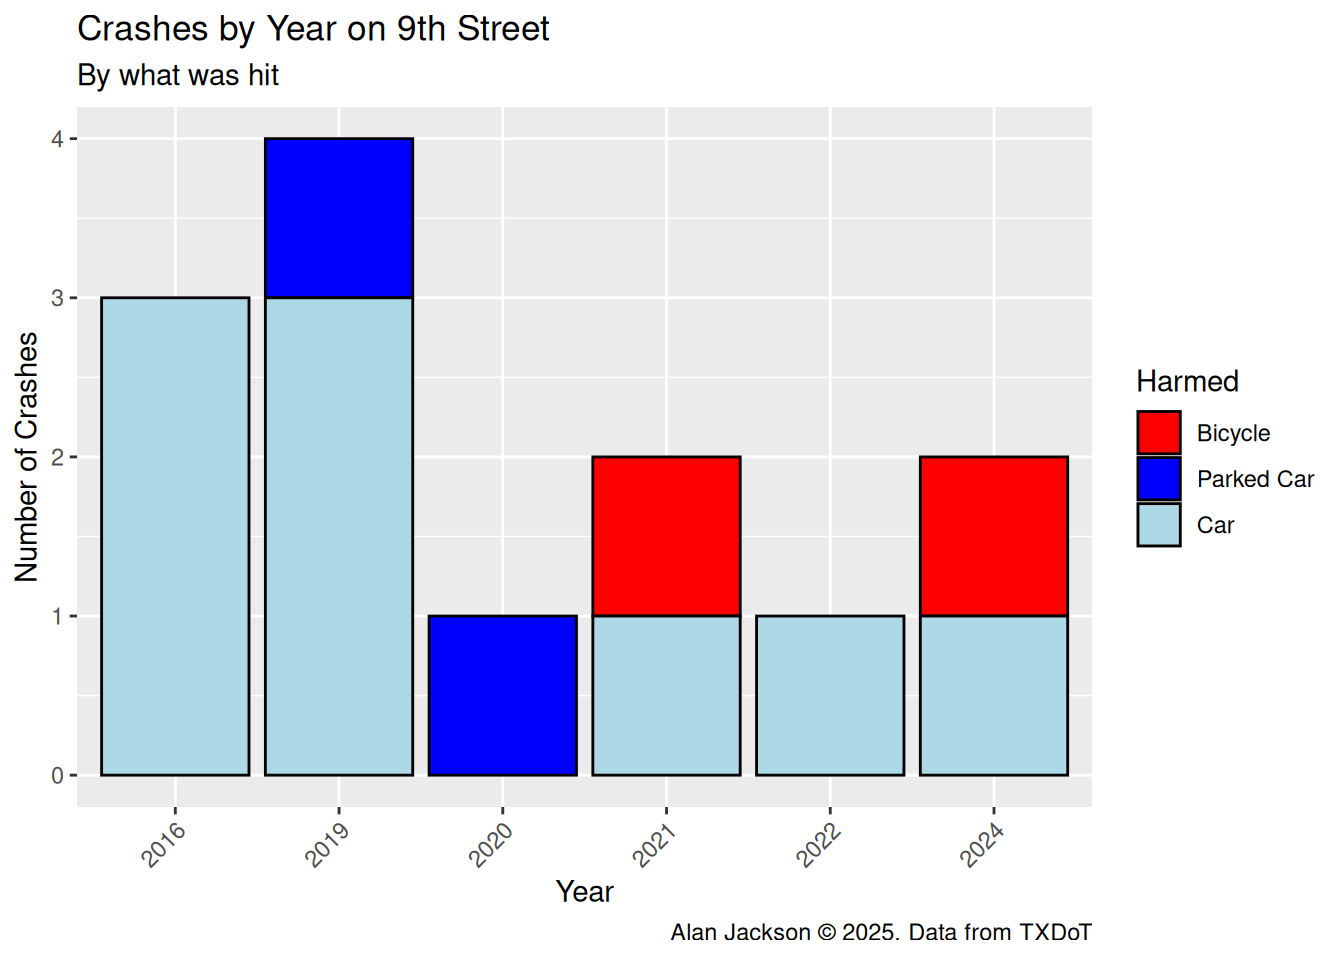
Now for 9 street
No issues at all.
Code
# Pull out 9th street and do some cleanupNineth <- df %>%filter(City=="Houston") %>%filter(stringr::str_detect(Rpt_Street_Name, "^9 ?TH")) %>%mutate(Rpt_Street_Name=stringr::str_remove(Rpt_Street_Name, "E | ST| 12| ")) %>%mutate(Severity=factor(Severity, levels=c("NOT INJURED", "POSSIBLE INJURY","NON-INCAPACITATING", "SUSPECTED SERIOUS INJURY","FATAL", "UNKNOWN"))) %>%mutate(Harmed=factor(Harmed, levels=c("Motor Vehicle in Transport","Fixed Object", "Parked Car","Pedestrian", "Pedal Cyclist","Overturned", "Other Object", "Animal","Other Non-Collision", "Rail Road"))) Nineth <- Nineth %>%mutate(Lat=as.numeric(Latitude)) %>%mutate(Lon=as.numeric(Longitude)) # Make plot Harm_plot(Nineth, "9th")
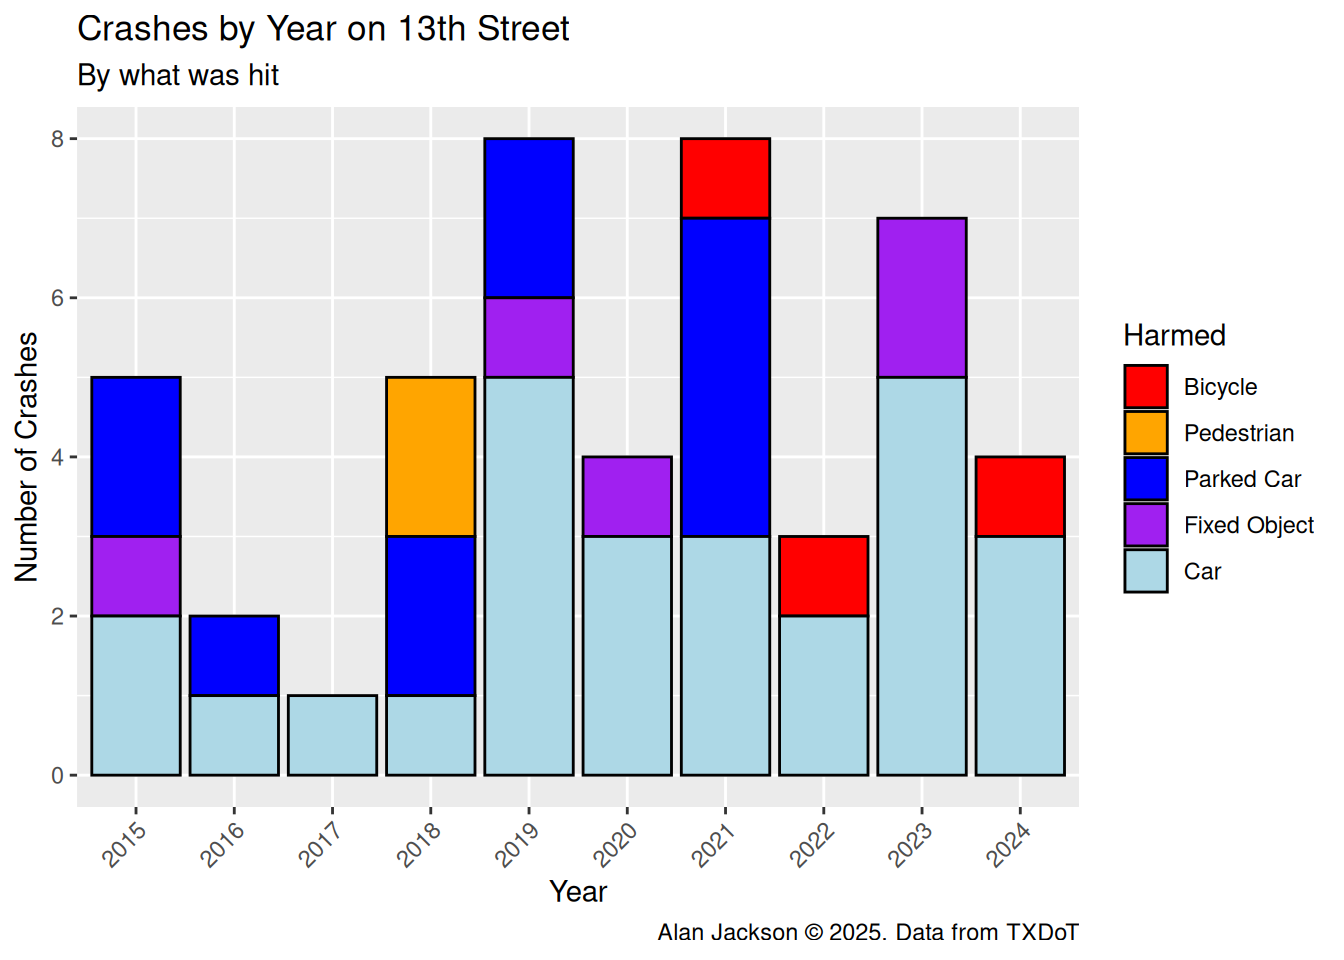
Now for 13th street
Pretty well behaved. Added 2 lat/longs. But really, what is it about 13th that causes it to have a surprisingly high crash count? It’s not a very good street to cut through - the west portion has speed humps. A mystery.
Code
# Pull out 13th street and do some cleanupThirteenth <- df %>%filter(City=="Houston") %>%filter(stringr::str_detect(Rpt_Street_Name, "^13 ?TH")) %>%mutate(Rpt_Street_Name=stringr::str_remove(Rpt_Street_Name, "E | ST| 12| ")) %>%mutate(Severity=factor(Severity, levels=c("NOT INJURED", "POSSIBLE INJURY","NON-INCAPACITATING", "SUSPECTED SERIOUS INJURY","FATAL", "UNKNOWN"))) %>%mutate(Harmed=factor(Harmed, levels=c("Motor Vehicle in Transport","Fixed Object", "Parked Car","Pedestrian", "Pedal Cyclist","Overturned", "Other Object", "Animal","Other Non-Collision", "Rail Road"))) # These records have no lat/long, so I will add them by handAdd_coord <-tribble(~Crash_ID, ~Latitude, ~Longitude,"15112001", "29.7945152", "-95.39378753","14326861", "29.7945152", "-95.39378753" )for (i in1:2) { Thirteenth[Thirteenth$Crash_ID==Add_coord[i,]$Crash_ID,]$Latitude <- Add_coord[i,]$Latitude Thirteenth[Thirteenth$Crash_ID==Add_coord[i,]$Crash_ID,]$Longitude <- Add_coord[i,]$Longitude}Thirteenth <- Thirteenth %>%mutate(Lat=as.numeric(Latitude)) %>%mutate(Lon=as.numeric(Longitude)) # Make plot Harm_plot(Thirteenth, "13th")
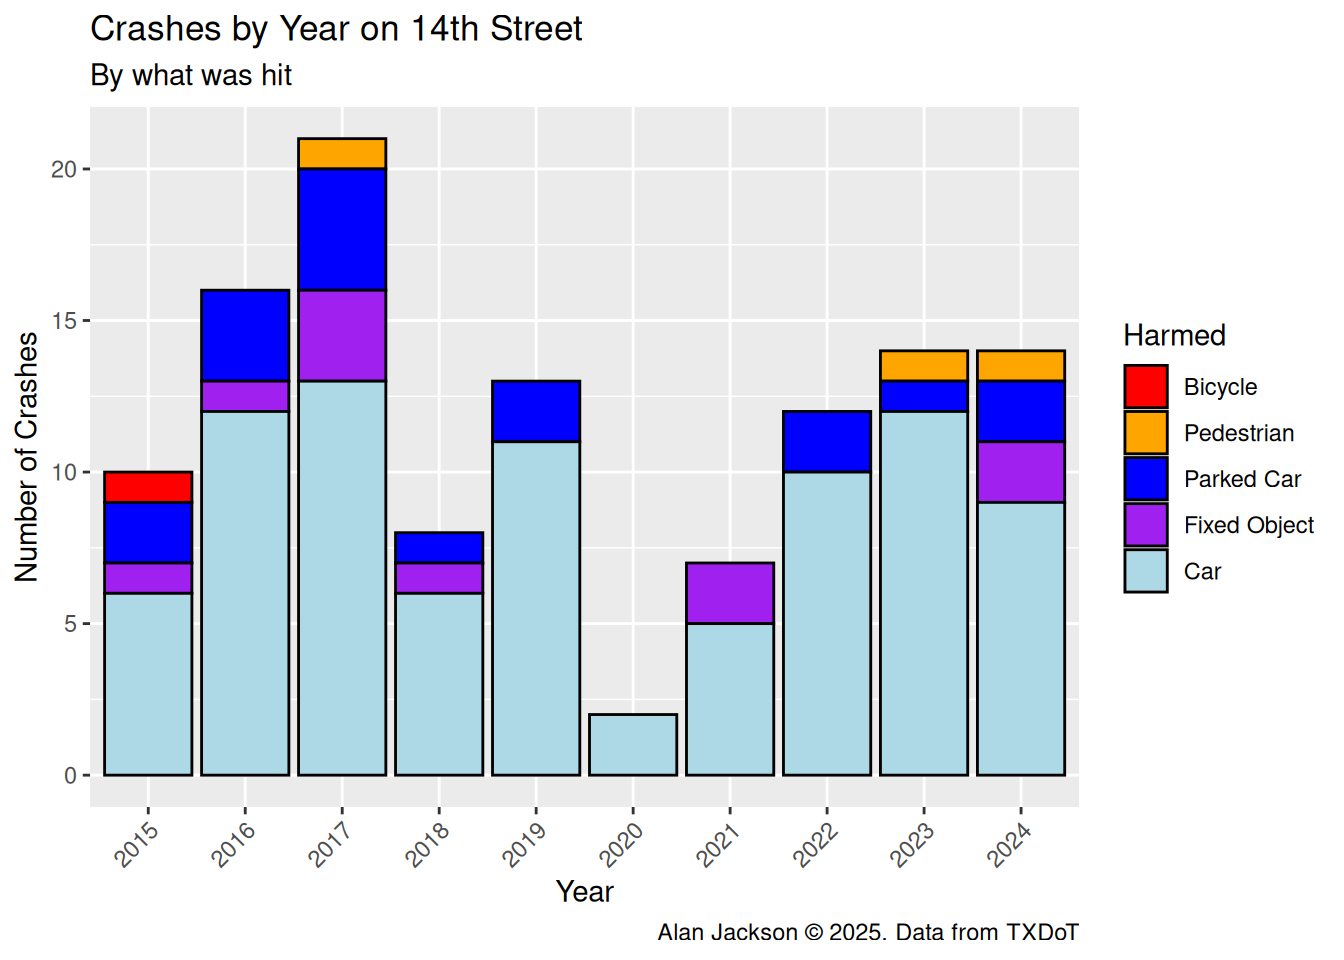
Now for 14th street
There is a N 14th down near Sharpstown, so I’ll eliminate those.
It is a busy street, with too few stop signs, and wide enough that it encourages speeding. I’d love to see it put on a diet.
Code
# Pull out 14th street and do some cleanupFourteenth <- df %>%filter(City=="Houston") %>%filter(stringr::str_detect(Rpt_Street_Name, "^14 ?TH")) %>%mutate(Rpt_Street_Name=stringr::str_remove(Rpt_Street_Name, "E | ST| 12| ")) %>%filter(as.integer(Rpt_Block_Num) <2000) %>%mutate(Severity=factor(Severity, levels=c("NOT INJURED", "POSSIBLE INJURY","NON-INCAPACITATING", "SUSPECTED SERIOUS INJURY","FATAL", "UNKNOWN"))) %>%mutate(Harmed=factor(Harmed, levels=c("Motor Vehicle in Transport","Fixed Object", "Parked Car","Pedestrian", "Pedal Cyclist","Overturned", "Other Object", "Animal","Other Non-Collision", "Rail Road"))) %>%# Get some of the missing block numbersmutate(Rpt_Block_Num=if_else(is.na(Rpt_Block_Num), as.character(100*as.integer(as.numeric(Street_Nbr)/100)), Rpt_Block_Num))# Bad block number - repairFourteenth[Fourteenth$Crash_ID=="17528832",]$Rpt_Block_Num <-"1800"Fourteenth <- Fourteenth %>%mutate(Lat=as.numeric(Latitude)) %>%mutate(Lon=as.numeric(Longitude)) # Make plot Harm_plot(Fourteenth, "14th")
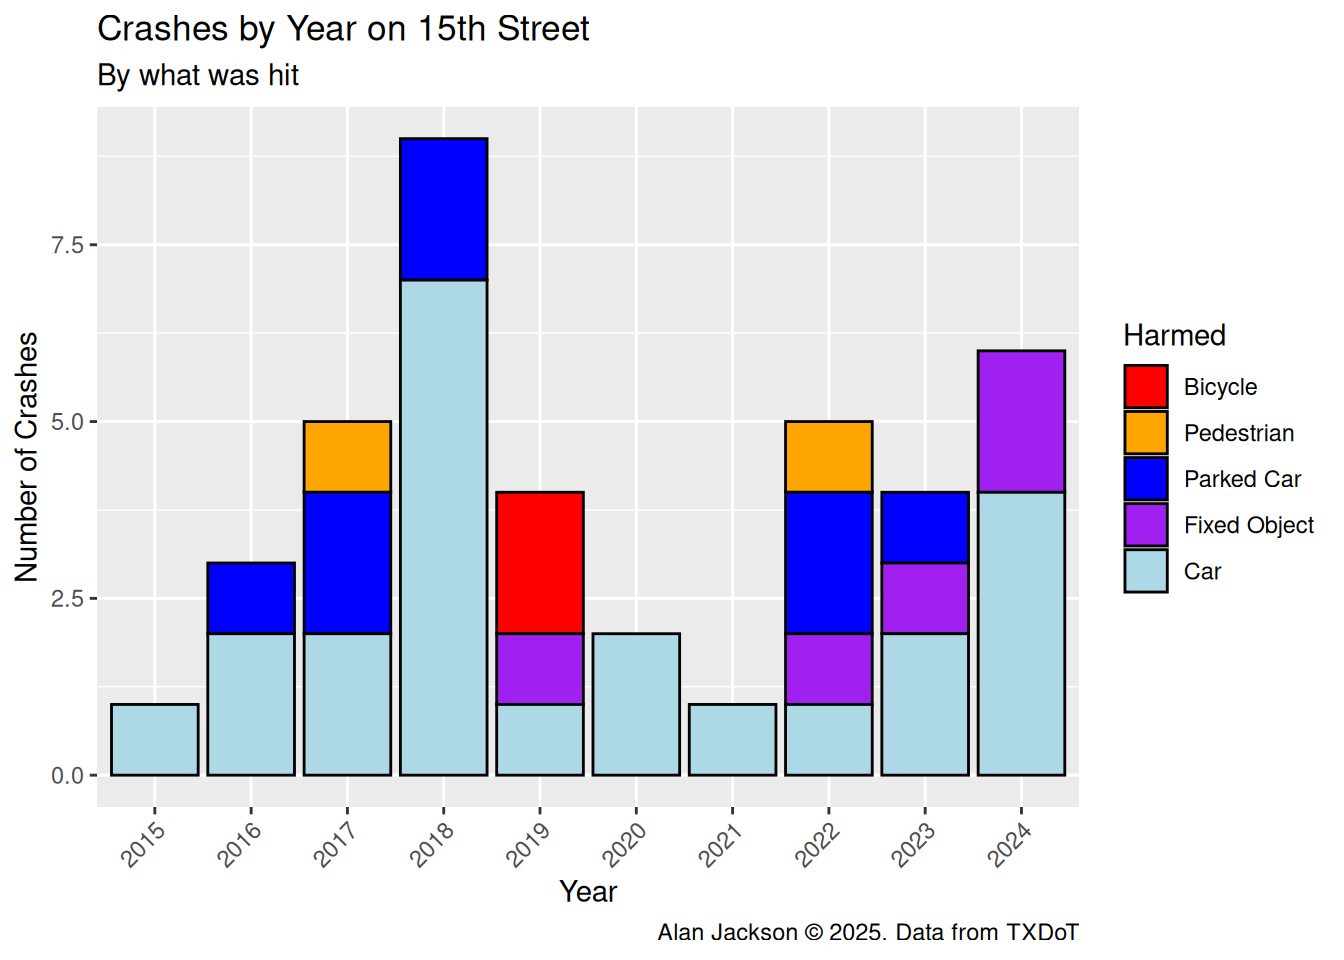
Now for 15th street
Fifteenth had a few issues - I added two lat/longs by hand and had to eliminate some odd records by using the latitude limits.
Code
# Pull out 13th street and do some cleanupFifteenth <- df %>%filter(City=="Houston") %>%filter(stringr::str_detect(Rpt_Street_Name, "^15 ?TH")) %>%mutate(Rpt_Street_Name=stringr::str_remove(Rpt_Street_Name, "E | ST| 12| ")) %>%mutate(Severity=factor(Severity, levels=c("NOT INJURED", "POSSIBLE INJURY","NON-INCAPACITATING", "SUSPECTED SERIOUS INJURY","FATAL", "UNKNOWN"))) %>%mutate(Harmed=factor(Harmed, levels=c("Motor Vehicle in Transport","Fixed Object", "Parked Car","Pedestrian", "Pedal Cyclist","Overturned", "Other Object", "Animal","Other Non-Collision", "Rail Road"))) %>%# Get some of the missing block numbersmutate(Rpt_Block_Num=if_else(is.na(Rpt_Block_Num), as.character(100*as.integer(as.numeric(Street_Nbr)/100)), Rpt_Block_Num))# Three records have no lat/long, so I will add them by handAdd_coord <-tribble(~Crash_ID, ~Latitude, ~Longitude,"19006607", "29.7978636", "-95.41348899","16506054", "29.7980649", "-95.39804542" )for (i in1:2) { Fifteenth[Fifteenth$Crash_ID==Add_coord[i,]$Crash_ID,]$Latitude <- Add_coord[i,]$Latitude Fifteenth[Fifteenth$Crash_ID==Add_coord[i,]$Crash_ID,]$Longitude <- Add_coord[i,]$Longitude}# Filter out by latitudeFifteenth <- Fifteenth %>%filter(between(as.numeric(Latitude), 29.797, 29.799))Fifteenth <- Fifteenth %>%mutate(Lat=as.numeric(Latitude)) %>%mutate(Lon=as.numeric(Longitude)) # Make plot Harm_plot(Fifteenth, "15th")
Overall statistics
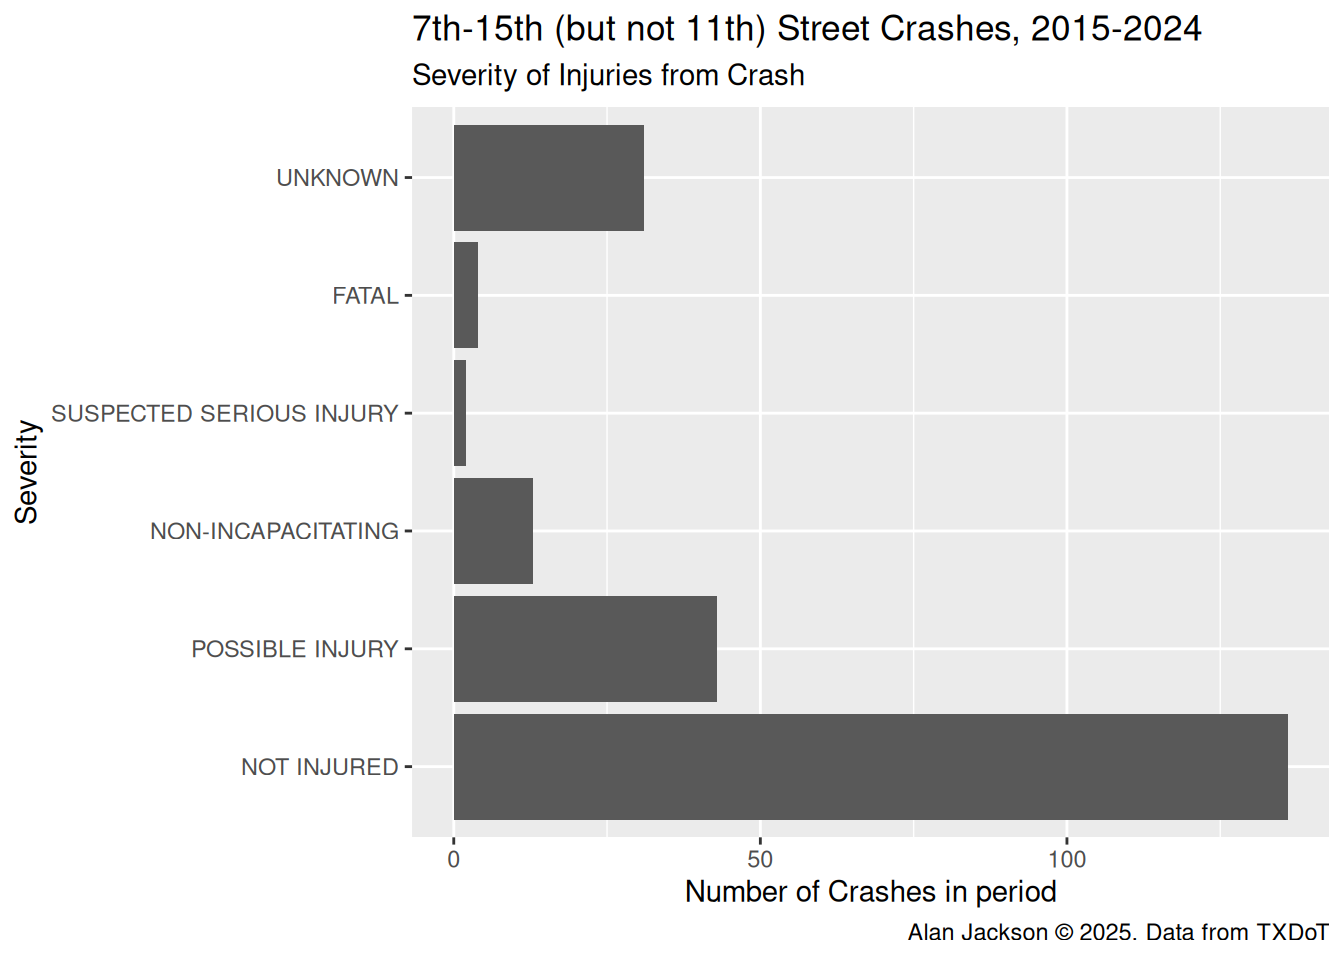
Let’s begin by simply looking at some overall statistics, to get a feel for the data.
It is a small dataset, so lets put them on a map.
14th street looks like a problem - but I already knew that. People routinely drive 40 mph down 14th - too few stop signs and too wide. And no continuous sidewalks west of Yale. But even 13th has more crashes than 12th or 10th. Curious.
Because the data is poorly populated west of Shepherd, and east of Studewood, I will delete those points and just focus on that center section.
Code
All_data <-rbind(Seventh, Eighth, Nineth, Tenth, Twelfth, Thirteenth, Fourteenth, Fifteenth) %>% sf::st_as_sf(., coords=c("Lon","Lat"),crs=4326)# tmap::tmap_options(basemaps="OpenStreetMap")tmap::tmap_options(basemap.server="OpenStreetMap")tmap::tmap_mode("view") # set mode to interactive plots# tmap mode set to interactive viewing tmap::tm_shape(All_data) + tmap::tm_dots(size=0.5, fill="Severity")
Code
# Trim the data at Shepherd and StudewoodAll_data <- All_data %>%filter(as.numeric(Longitude)>-95.410468) %>%filter(as.numeric(Longitude)<-95.387518)
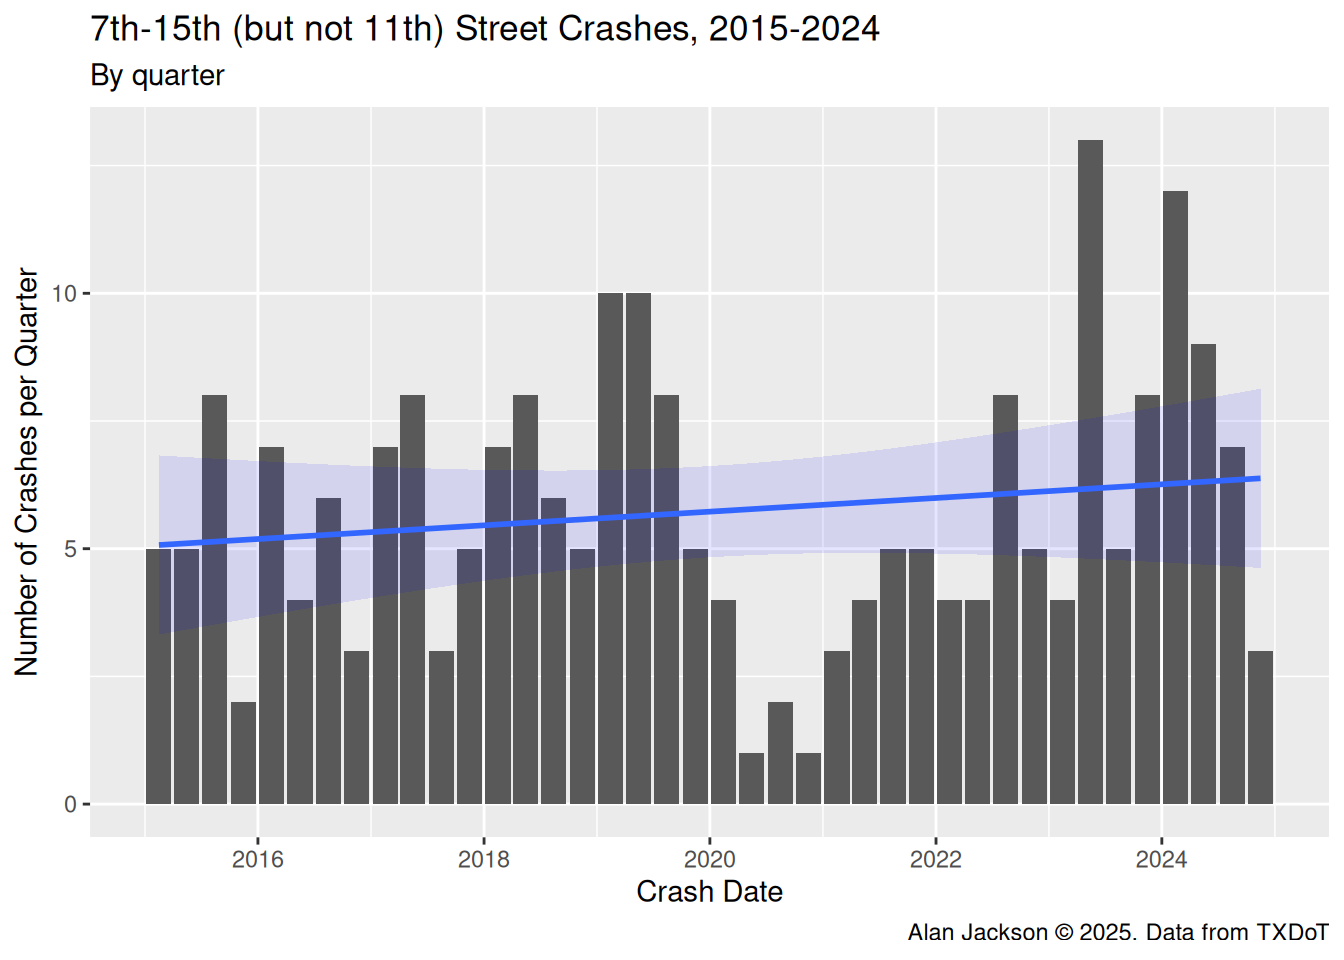
All crashes along the entire length of the streets by quarter.
In the composite, a very slight increase over time, of about one extra crash per quarter over a period of ten years, and well within the error bars. Statistically insignificant. We’ll look more closely at this.
# Round off block numbers again and add a block counterAll_data <- All_data %>%mutate(Lat=as.numeric(Latitude)) %>%mutate(Lon=as.numeric(Longitude)) %>%arrange(Lon) %>%mutate(Rpt_Block_Num=as.character(100*as.integer(as.numeric(Rpt_Block_Num)/100+0.5))) # For blocks west of HeightsCounter_w <-tibble(Block=(14:1)*100) %>%mutate(Counter=row_number()) %>%mutate(Prefix="W")# For blocks east of HeightsCounter_e <-tibble(Block=(1:11)*100) %>%mutate(Counter=row_number()+15) %>%mutate(Prefix="E")Counter <-rbind(Counter_w, Counter_e) %>%mutate(Block=as.character(Block)) %>%mutate(Counter=factor(as.character(Counter), levels=(as.character(Counter))))keep <- All_dataAll_data <- All_data %>%inner_join(., Counter, join_by(Rpt_Block_Num==Block, Rpt_Street_Pfx==Prefix))saveRDS(All_data, "All_data.rds")
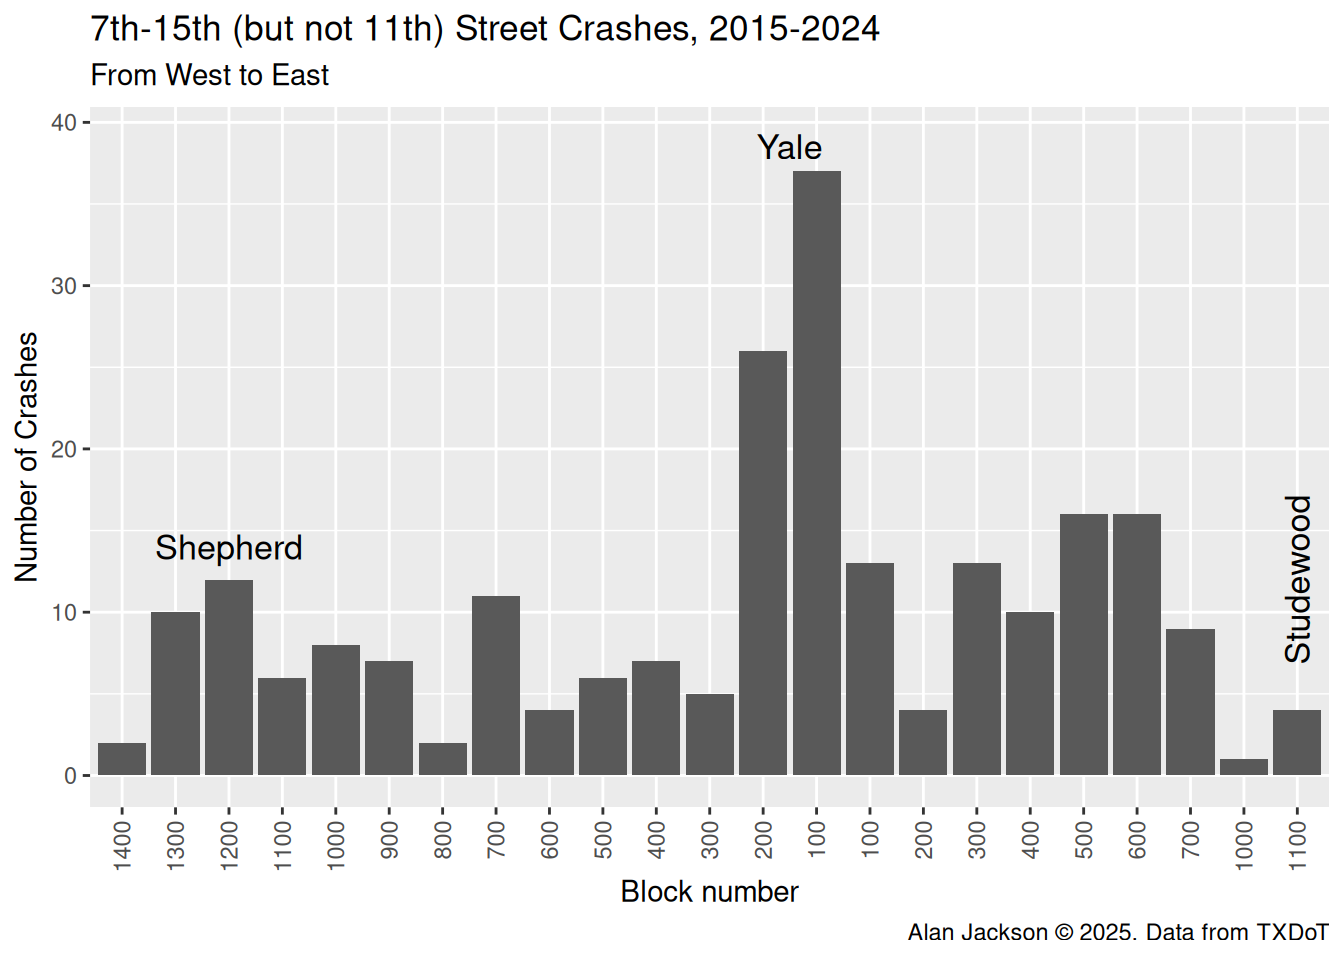
Let’s plot the data from west to east
The thing that stands out here is how dangerous it is to try to cross or turn on to Yale from any of the side streets. Something all of us in the neighborhhood already knew - but pretty dramatic none the less.
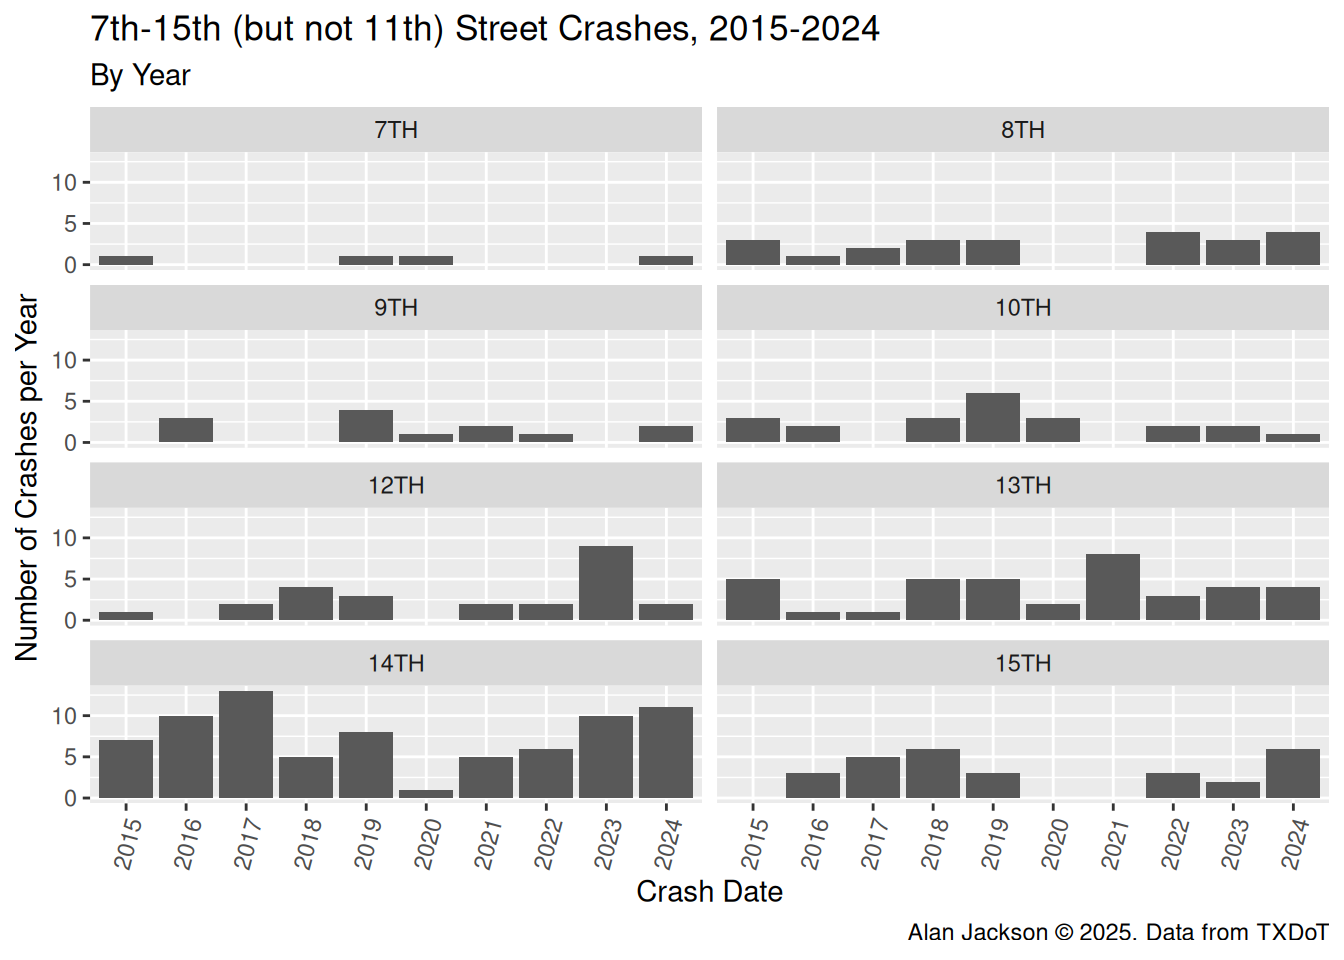
Let’s look at each street individually, crashes per year.
Tenth street actually shows a slight decline in crashes, while 12th street has a large spike in 2023, but then a large decrease in 2024. Really all the streets individually look basically flat in terms of crashes.
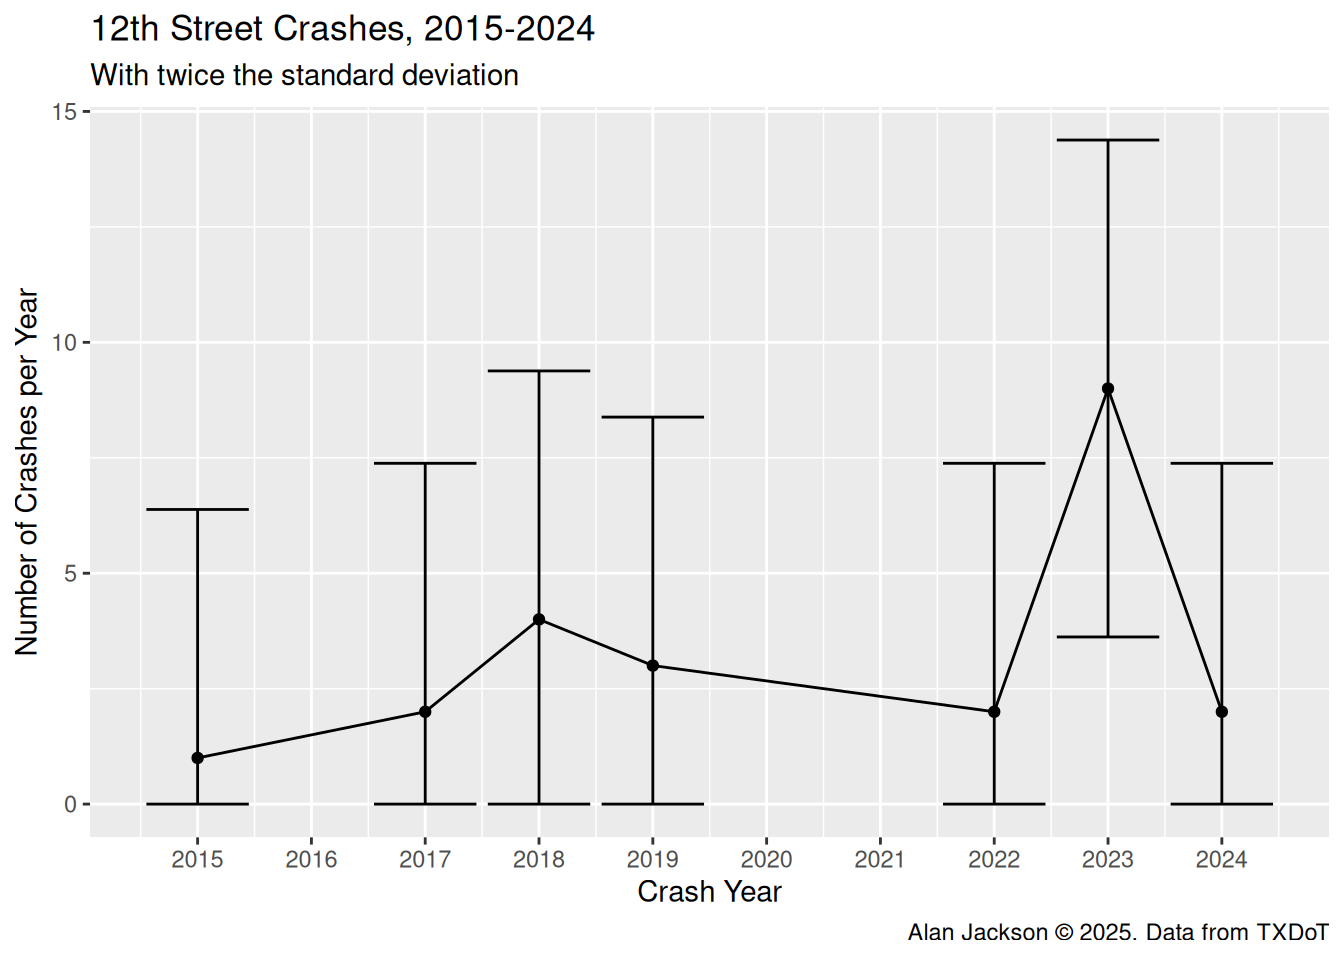
Let’s look more closely at 12th, since it is the only street that may show an increase in crashes. The error bars show that the spike is probably not quite statistically significant - large overlap in the error bars.
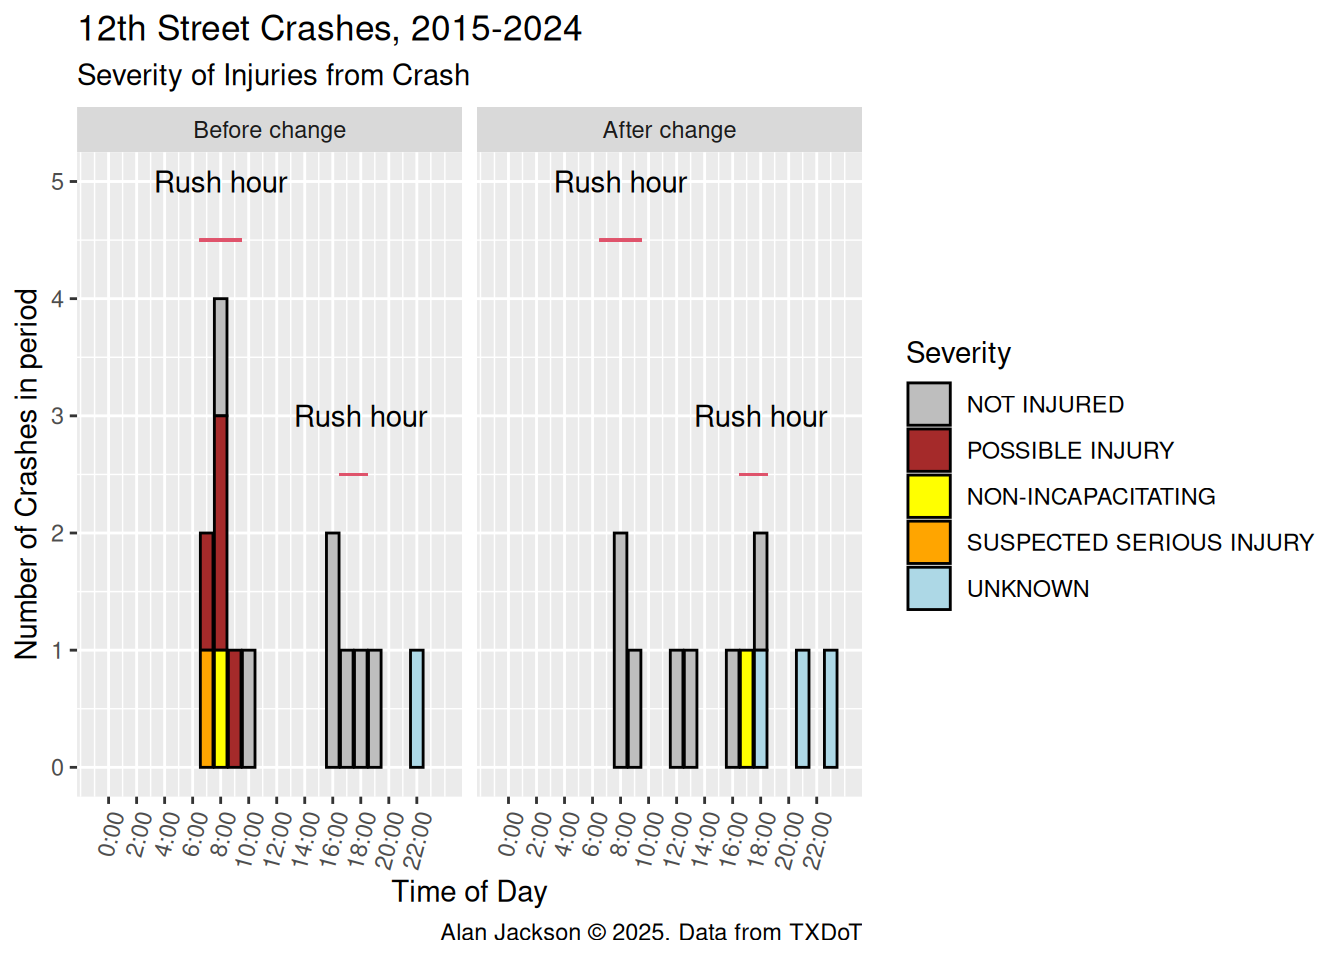
How about time of day? I would expect that if 12th is being used as a detour for 11th that would primarily occur during rush hour when 11th can get backed up.
The relative number of crashes during rush hour before and after the 11th street modifications is 0.64 and 0.55, so basically equal. I see no significant difference in crashes during rush hour.
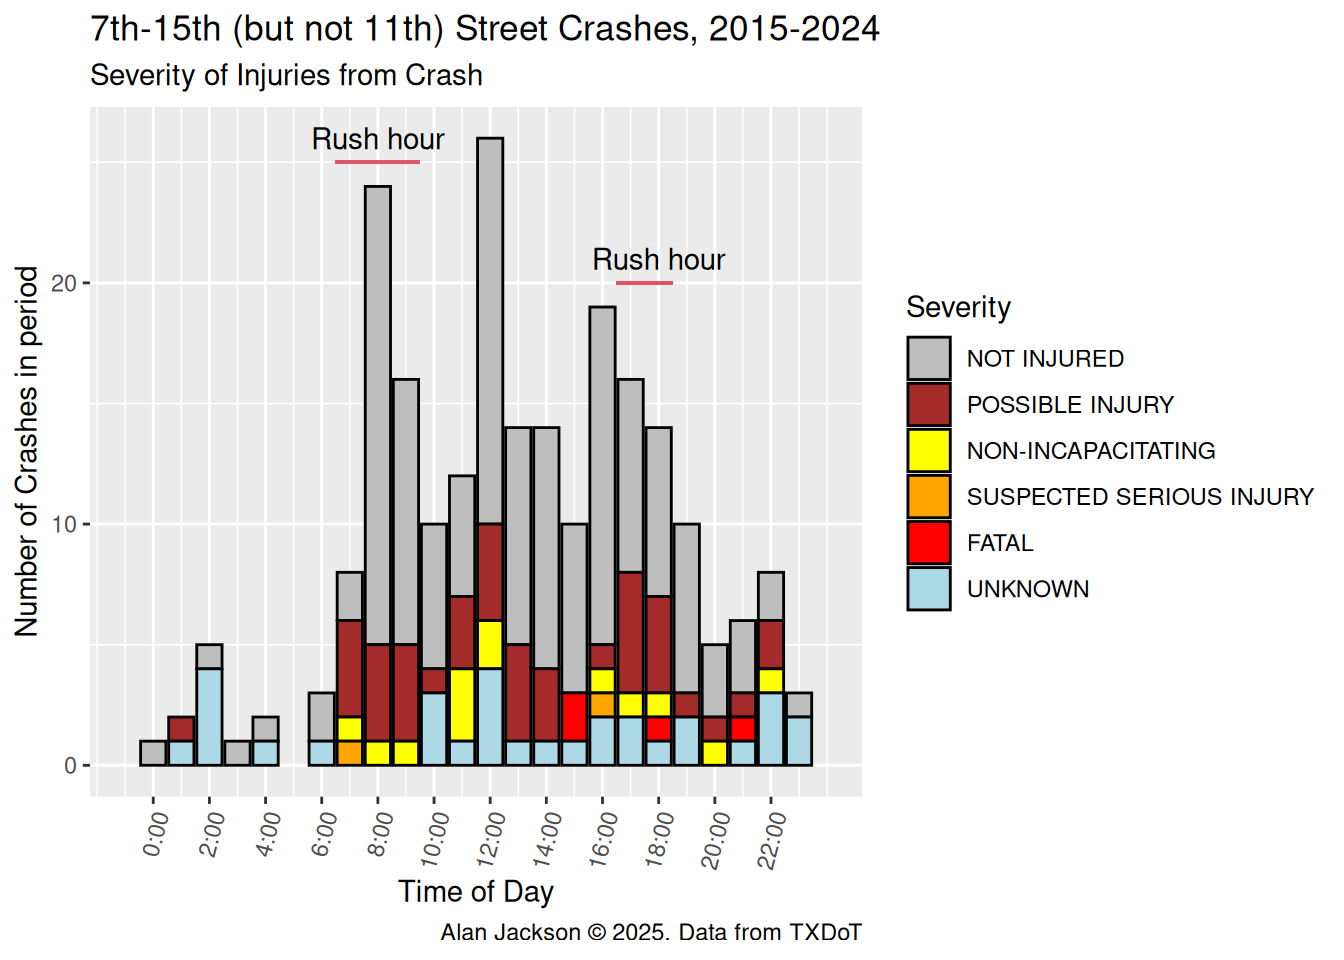
If we look at all the data by time of day (noting that 14th street tends to dominate), we see that rush hour and lunchtime are the big spikes. It looks like people are probably more likely to be rushing, and taking chances, when trying to get to work on time in the morning, and trying to get back to work on time after lunch. Also looks like a good argument for brown bagging it.
Let’s look at all the Pedestrian and Bicycle injuries
There are really too few to make any meaningful statistical statement.
However, note too that statistically, intersections are the most dangerous locations, and almost all of these occured near or at intersections. Also, there were 19 injuries to cyclists or pedestrians on these side streets, as compared to 10 on 11th street in the same period, which raises the question, “is cycling on a side street really safer than cycling on 11th?” Since most crashes occur at intersections, it is perhaps not surprising that the numbers are not too different. Additionally, all the fatalities occured on the side streets, not 11th.
From these datasets, it does not appear that there has been a significant diversion of traffic onto streets parallel to 11th. If there has, it has not increased the crash rates on those side streets, so is likely moving more slowly and more safely.
In any event, for 2023 and 2024, there have been about 10 fewer crashes on 11th than history would predict, while the increase on Tenth and Twelfth has been around 4 at most, so a net gain, even if traffic is diverting to Twelfth and Tenth.
Note on the fatalities
There have been four fatalities on these side streets in the study period. Let’s take a closer look.
Date & Time
Block & Street
Incident Report
18 May 2017 at 9:26 PM
100 15th
Houston Police say an elderly woman died after she was struck by an SUV driver who then left the scene. It happened on Heights Boulevard at 15th Street at about 9:30 p.m. Thursday. Police say the 91-year old woman, now identified as Erlene Gomez, got off a bus and was walking on 15th when a white Toyota SUV, possibly a Sequoia or 4-Runner, struck her from behind and then possibly ran her over. A witness told police the driver left the scene slowly, leading police to believe the suspect lives in the neighborhood.
7 March 2019 at 3:05 PM
100 8th
In March 2019, a fatal collision occurred involving a Houston ISD school bus and a cyclist near the intersection of Heights Boulevard and 8th Street in the Heights neighborhood of Houston. The cyclist, believed to be trying to avoid a collision, slid under the bus and was fatally injured by the back axle.
15 August 2023 at 6:55 PM
1200 10th
Houston police are investigating a fatal crash at 1100 West 10th Street about 6:55 p.m. on Tuesday (August 15). The identity of the deceased female, 55, is pending verification by the Harris County Institute of Forensic Sciences. HPD Vehicular Crimes Division Sergeant R. Dallas and Central Patrol Division Officers reported: The female, in an electric wheelchair, was traveling northbound on Dorothy Street. As she entered the intersection of West 10th Street, she was struck by a gray Ford Explorer traveling westbound on West 10th Street. Houston Fire Department paramedics transported the woman to Memorial Hermann-Texas Medical Center where she was later pronounced deceased. The male driver, 71, remained at the scene. was determined not to be impaired and was questioned and released.
19 Feb 2024 at 3:35 PM
100 14th
Houston police are investigating a fatal crash at 101 East 14th Street about 3:35 p.m. on Monday (Feb. 19). The identity of the deceased female victim, 95, is pending verification by the Harris County Institute of Forensic Sciences. HPD Vehicular Crimes Division Sergeant S. Jewell and and Officer C. Song reported: A silver Chevrolet Suburban was traveling westbound at the above address and had a green light at the intersection of Heights Boulevard. When the driver made a left turn to go southbound on Heights Blvd., she struck a female pedestrian crossing Heights Blvd. in the crosswalk. Paramedics transported the woman to a hospital where she was later pronounced deceased. The female driver, 52, was questioned and did not show signs of intoxication. She was released pending further investigation.