Analyze TxDoT Crash Data for 11th Street

Mapping
Supporting Activism
Harris county
Take a look at the crash data for 11th street in the Houston Heights
Author

Alan Jackson

Published

April 12, 2025

11th Street Crash Data

11th street in the Houston Heights was reduced from 4 lanes to two, with the addition of protected bicycle lanes, between October 2022 and January 2023. The primary goal was to calm the traffic on 11th and get people to drive the speed limit as it had become quite dangerous.

The portion of the street that was re-engineered went from the intersection at Shepherd east to the end of the street at Michaux.

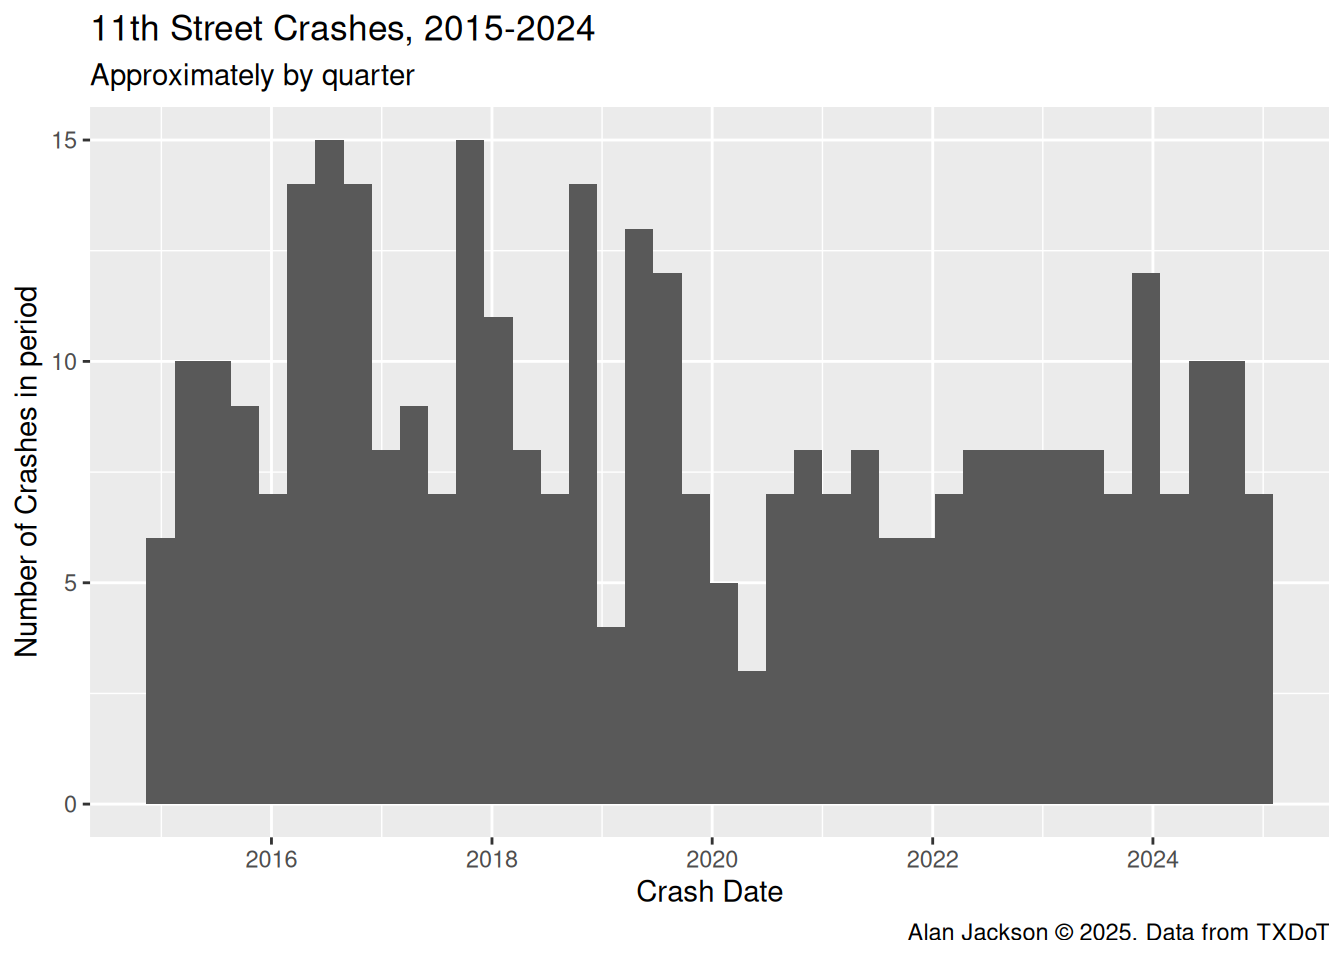
Now that we have 2 years of data from TxDoT on crashes, we can look at how effective the changes may have been.

Let’s pull out eleventh street and do some data cleanup

There are some obvious typos in the street names and block numbers Also there are missing lat longs, so we will just calculate our own for everywhere, since I don’t know what geoid was used for these anyway.

Code
#   Pull out 11th street and do some cleanup

Eleventh <- df %>% 
  filter(City=="Houston") %>% 
  filter(stringr::str_detect(Rpt_Street_Name, "11 ?TH")) %>% 
  mutate(Rpt_Street_Name=stringr::str_remove(Rpt_Street_Name, "E | ST| 12| ")) %>% 
  mutate(Severity=factor(Severity, levels=c("NOT INJURED", "POSSIBLE INJURY",
                                            "NON-INCAPACITATING", 
                                            "SUSPECTED SERIOUS INJURY",
                                            "FATAL", "UNKNOWN"))) %>% 
  mutate(Harmed=factor(Harmed, levels=c("Motor Vehicle in Transport",
                                        "Fixed Object", "Parked Car",
                                        "Pedestrian", "Pedal Cyclist",
                                        "Overturned", "Other Object", "Animal",
                                        "Other Non-Collision", "Rail Road"))) %>% 
  #   Get some of the missing block numbers
  mutate(Rpt_Block_Num=if_else(is.na(Rpt_Block_Num), 
                               as.character(100*as.integer(as.numeric(Street_Nbr)/100)), 
                               Rpt_Block_Num))

Geocode addresses

About 20% of the records have no lat-long attached, so I will geocode the records to fill in those blanks. There are two records where there is no block number, so those will be dropped as there is no way to know where on 11th street they are.

Code
Exact_match <- NULL
Failed_match <- NULL

Eleventh <- Eleventh %>% 
  filter(!is.na(Rpt_Block_Num)) %>% 
  filter(!is.na(Rpt_Street_Pfx)) %>% 
  mutate(Zipcode="77008") %>% 
  mutate(Rpt_Street_Sfx="ST") %>% 
  mutate(Rpt_Block_Num=stringr::str_replace(Rpt_Block_Num, "..$", "25")) %>% 
  mutate(Zipcode=if_else((Rpt_Street_Pfx=="E")&(as.integer(Rpt_Block_Num)>=1100), 
                         "77009", "77008"))

#     Exact matches
for (i in 1:nrow(Eleventh)){ # first look for exact matches
  tmp <- match_exactly(Eleventh[i,]$Rpt_Block_Num, Eleventh[i,]$Rpt_Street_Pfx,
  Eleventh[i,]$Rpt_Street_Name, Eleventh[i,]$Rpt_Street_Sfx, Eleventh[i,]$Zipcode)
  
  if (tmp$Success){ #   success
    Exact_match <- cbind(Eleventh[i,], tmp) %>% 
      select(Crash_ID, Rpt_Block_Num, Rpt_Street_Pfx, Rpt_Street_Name, 
             Rpt_Street_Sfx, Zipcode, Lat, Lon) %>% 
      rbind(., Exact_match)
  } else { #  Fail exact match
    Failed_match <- cbind(Eleventh[i,], tmp) %>% 
      select(Crash_ID, Rpt_Block_Num, Rpt_Street_Pfx, Rpt_Street_Name, 
             Rpt_Street_Sfx, Zipcode, Fail, Lat, Lon) %>% 
      rbind(., Failed_match)
  }
}

#   add a field to hold the corrected data if any
Failed_match <- Failed_match %>% mutate(Correction=NA)

#   Repair number

for (i in 1:nrow(Failed_match)){
  target <- Failed_match[i,]
  tmp <- repair_number(target$Rpt_Block_Num, target$Rpt_Street_Pfx, 
                       target$Rpt_Street_Name,
                       target$Rpt_Street_Sfx, target$Zipcode, Distance=550)
  if (tmp$Success){ #   success
    Failed_match[i,]$Lat <- tmp$Lat
    Failed_match[i,]$Lon <- tmp$Lon
    Failed_match[i,]$Correction <- tmp$Result
  } else {
    Failed_match[i,]$Fail <- paste("Street_num",tmp$Fail)
  }
}

#   pull out failed matches

Matches <- Failed_match %>% 
  filter(Lat>0) %>% 
  select(-Correction, -Fail) %>% 
  rbind(., Exact_match)

Failed_match <- Failed_match %>% 
  filter(Lat==0) %>% 
  mutate(Rpt_Block_Num=stringr::str_replace(Rpt_Block_Num, "..$", "24"))  

#   Repair number

for (i in 1:nrow(Failed_match)){
  target <- Failed_match[i,]
  tmp <- repair_number(target$Rpt_Block_Num, target$Rpt_Street_Pfx, 
                       target$Rpt_Street_Name,
                       target$Rpt_Street_Sfx, target$Zipcode, Distance=550)
  if (tmp$Success){ #   success
    Failed_match[i,]$Lat <- tmp$Lat
    Failed_match[i,]$Lon <- tmp$Lon
    Failed_match[i,]$Correction <- tmp$Result
  } else {
    Failed_match[i,]$Fail <- paste("Street_num",tmp$Fail)
  }
}

#   pull out failed matches

Matches <- Failed_match %>% 
  filter(Lat>0) %>% 
  select(-Correction, -Fail) %>% 
  rbind(., Matches)

Failed_match <- Failed_match %>% 
  filter(Lat==0)  
  
#   Add new lat longs to master file

Eleventh <- Matches %>% 
  select(Crash_ID, Lat, Lon) %>% 
  left_join(Eleventh, ., by="Crash_ID")

#   Dump remaining unknown lat/longs for hand edits

foo <- Eleventh %>% 
  filter(is.na(Lat) & is.na(Latitude))

Eleventh[Eleventh$Crash_ID=="19420144",]$Lat <- 29.789750981741
Eleventh[Eleventh$Crash_ID=="19420144",]$Lon <- -95.42065368245
Eleventh[Eleventh$Crash_ID=="19519095",]$Lat <- 29.789750981741
Eleventh[Eleventh$Crash_ID=="19519095",]$Lon <- -95.42065368245
Eleventh[Eleventh$Crash_ID=="19112620",]$Lat <- 29.790612430221
Eleventh[Eleventh$Crash_ID=="19112620",]$Lon <- -95.39807436273
Eleventh[Eleventh$Crash_ID=="18449355",]$Lat <- 29.790612430221
Eleventh[Eleventh$Crash_ID=="18449355",]$Lon <- -95.39807436273

Eleventh <- Eleventh %>% 
  mutate(Lat=if_else(is.na(Lat), as.numeric(Latitude), Lat)) %>% 
  mutate(Lon=if_else(is.na(Lon), as.numeric(Longitude), Lon))

Overall statistics

Let’s begin by simply looking at some overall statistics, to get a feel for the data.

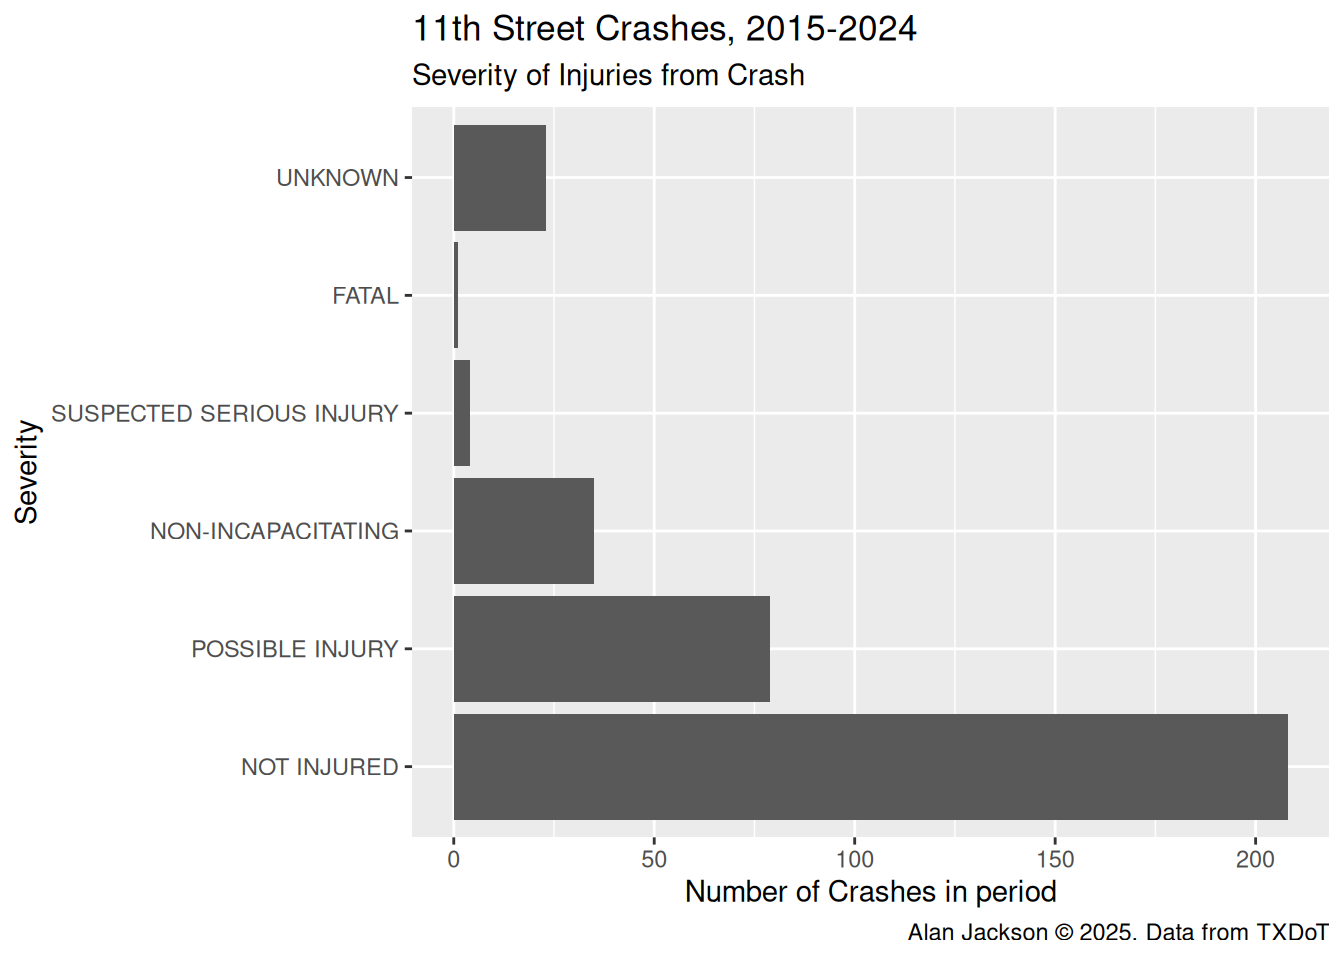
It looks like about 50% of the reported crashes resulted in injuries, although selection bias is certainly at work here. Crashes without an injury are much less likely to get reported at all.

Here is a random selection of records from the raw dataset.

Code
#   What sort of data do we have available?

Eleventh %>% 
  slice_sample(n=15) %>% #    pick 15 rows out at random
  select(Crash_Fatal_Fl, Date, Rpt_Block_Num, Rpt_Street_Pfx,
         Rpt_Street_Name, Rpt_Street_Sfx, Tot_Injry_Cnt, Death_Cnt, Severity,
         Harmed) %>% 
  gt() %>% 
  cols_label(
    Crash_Fatal_Fl="Fatal?",
    Date="Date",
    Rpt_Block_Num="Block",
    Rpt_Street_Pfx="Prefix",
    Rpt_Street_Name="Street",
    Rpt_Street_Sfx="Suffix",
    Tot_Injry_Cnt="# Injured?",
    Death_Cnt="Deaths",
    Severity="Severity",
    Harmed="Harmed"
  ) %>% 
  tab_footnote(
    html("Alan Jackson © 2025. Data from TXDoT")
  ) %>% 
  tab_header(
    title="Randon Selection of the Raw TXDoT data",
    subtitle="Years 2015-2024"
  )
Randon Selection of the Raw TXDoT data
Years 2015-2024
Fatal? Date Block Prefix Street Suffix # Injured? Deaths Severity Harmed
N 2019-05-07 11:49:00 325 W 11TH ST 1 0 NON-INCAPACITATING Motor Vehicle in Transport
N 2015-07-21 17:50:00 1125 E 11TH ST 0 0 NOT INJURED Motor Vehicle in Transport
N 2021-04-06 08:20:00 625 W 11TH ST 1 0 POSSIBLE INJURY Motor Vehicle in Transport
N 2015-09-24 07:28:00 1125 E 11TH ST 0 0 NOT INJURED Motor Vehicle in Transport
N 2016-12-30 13:13:00 725 E 11TH ST 0 0 NOT INJURED Motor Vehicle in Transport
N 2019-06-12 17:25:00 625 E 11TH ST 2 0 POSSIBLE INJURY Motor Vehicle in Transport
N 2016-09-03 14:00:00 125 W 11TH ST 1 0 POSSIBLE INJURY Motor Vehicle in Transport
N 2015-05-15 09:00:00 2025 W 11TH ST 0 0 NOT INJURED Motor Vehicle in Transport
N 2022-03-10 06:53:00 1325 W 11TH ST 3 0 POSSIBLE INJURY Motor Vehicle in Transport
N 2020-02-06 08:15:00 525 W 11TH ST 2 0 POSSIBLE INJURY Motor Vehicle in Transport
N 2021-04-08 11:15:00 1125 E 11TH ST 0 0 NOT INJURED Motor Vehicle in Transport
N 2015-11-15 15:50:00 2325 W 11TH ST 1 0 NON-INCAPACITATING Motor Vehicle in Transport
N 2024-06-28 14:38:00 1625 W 11TH ST 0 0 NOT INJURED Motor Vehicle in Transport
N 2021-10-19 20:30:00 1225 W 11TH ST 0 0 NOT INJURED Motor Vehicle in Transport
N 2017-03-23 18:05:00 2025 W 11TH ST 0 0 NOT INJURED Motor Vehicle in Transport
Alan Jackson © 2025. Data from TXDoT

All crashes along the entire length of the street by quarter.

Code
#   All crashes along entire length of street by date

Eleventh %>% 
  ggplot(aes(x=Date)) +
  geom_histogram(bins=40) +
  labs(title="11th Street Crashes, 2015-2024",
       subtitle="Approximately by quarter",
       x="Crash Date",
       y="Number of Crashes in period",
       caption="Alan Jackson © 2025. Data from TXDoT")

Distribution of the severity of injuries. Note that it is likely that crashes in which no one is injured are much more likely to not be reported, so those numbers are probably low.

Code
#   Severity of injuries in crashes

Eleventh %>% 
  ggplot(aes(Severity)) +
  geom_bar() +
  coord_flip() +
  labs(title="11th Street Crashes, 2015-2024",
       subtitle="Severity of Injuries from Crash",
       x="Severity",
       y="Number of Crashes in period",
       caption="Alan Jackson © 2025. Data from TXDoT")

What was hit? Mostly other cars that were also moving.

Code
#   What was hit - what was harmed

Eleventh %>% 
  ggplot(aes(Harmed)) +
  geom_bar() +
  coord_flip() +
  labs(title="11th Street Crashes, 2015-2024",
       subtitle="What was hit in Crash",
       x="Harm Caused",
       y="Number of Crashes in period",
       caption="Alan Jackson © 2025. Data from TXDoT")

How do crashes vary with the time of day?

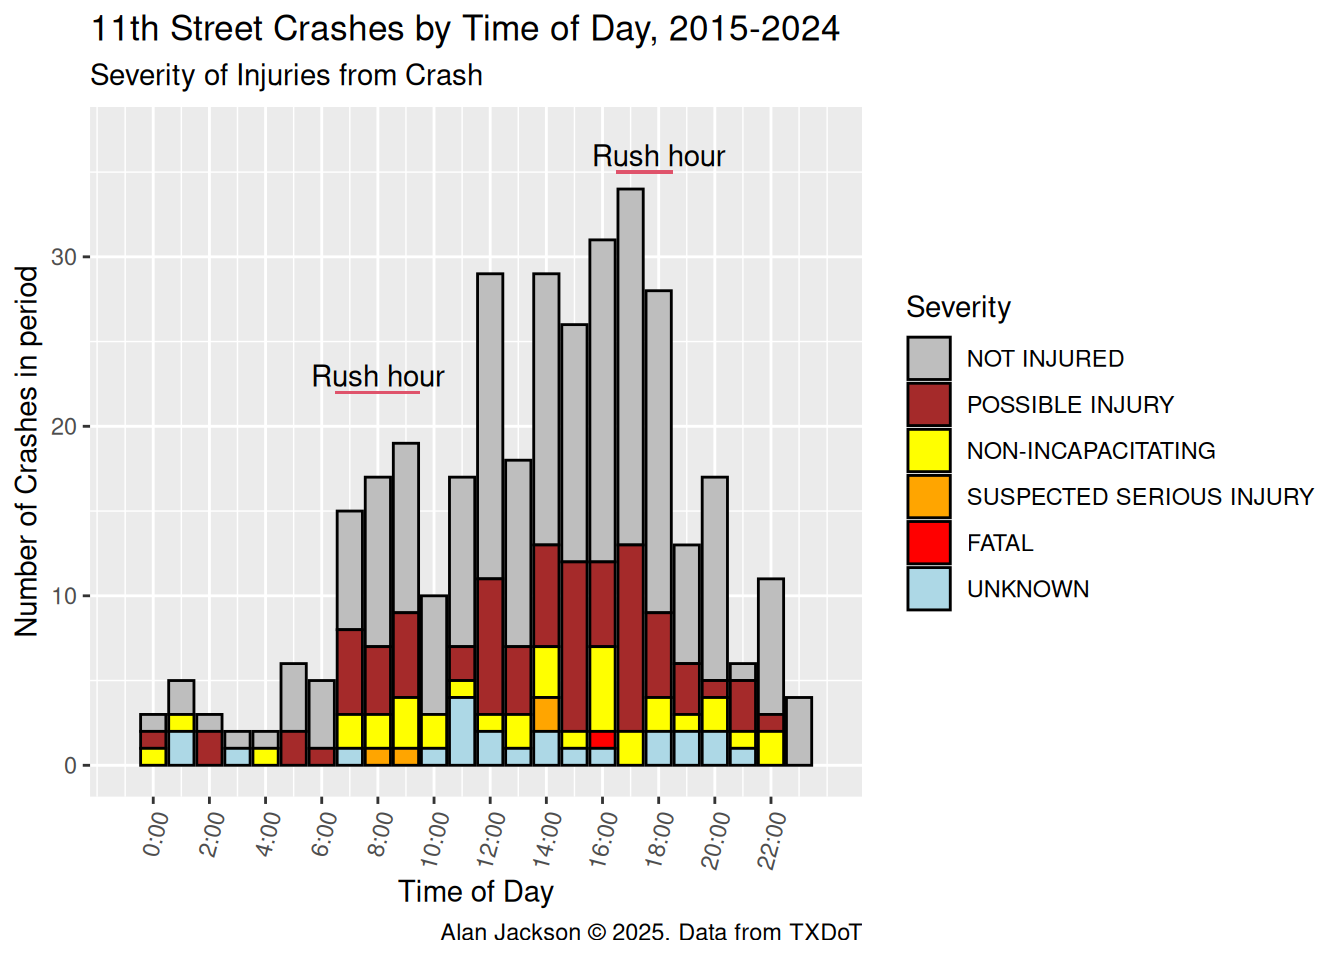
From noon until rush hour seems to be the most dangerous time, although except for the early morning hours, the fraction of crashes resulting in injury seems roughly constant.

Code
Eleventh %>% 
  mutate(ToD=hour(Date)) %>% 
  ggplot(aes(x=ToD)) +
  geom_bar() +
  scale_x_continuous(
   breaks = seq(0, 23, by = 2),
   labels = function(x) glue::glue("{x}:00"), #Format as H:M
   limits = c(-1, 24) # Set the limits to the full range of hours
  ) +
  geom_segment(x = 6.5, y = 22, xend = 9.5, yend = 22, color = 2) +
  annotate("text", 8, 23, label="Rush hour") +
  geom_segment(x = 16.5, y = 35, xend = 18.5, yend = 35, color = 2) +
  annotate("text", 18, 36, label="Rush hour") +
  expand_limits(y=c(0,37)) +
  geom_bar(color="black", stat="count", aes(fill=Severity)) +
  scale_fill_manual(values=c('NOT INJURED'="gray", 
                              'UNKNOWN'="lightblue",
                              'POSSIBLE INJURY'="brown",
                              'NON-INCAPACITATING'="yellow",
                              'FATAL'="red", 
                              'SUSPECTED SERIOUS INJURY'="orange")) + 
  theme(axis.text.x = element_text(angle = 75, vjust = 1.0, hjust=1)) +
  labs(title="11th Street Crashes by Time of Day, 2015-2024",
       subtitle="Severity of Injuries from Crash",
       x="Time of Day",
       y="Number of Crashes in period",
       caption="Alan Jackson © 2025. Data from TXDoT")

Let’s add a field to flag where the bike lanes are

The bike lanes run from Shepherd on the west, to Michaux on the east.

Code
Eleventh <- Eleventh %>% 
  mutate(Calm=TRUE) %>% 
  mutate(Calm=if_else(Lon< -95.40986818316094, FALSE, Calm)) %>% 
  mutate(Calm=if_else(Lon> -95.38434146384971, FALSE, Calm))  

#   Round off block numbers again and add a block counter

foo_w <- Eleventh %>% 
  arrange(Lon) %>% 
  mutate(Rpt_Block_Num=stringr::str_replace(Rpt_Block_Num, "..$", "00")) %>% 
  filter(Rpt_Street_Pfx=="W")
foo_e <- Eleventh %>% 
  arrange(Lon) %>% 
  mutate(Rpt_Block_Num=stringr::str_replace(Rpt_Block_Num, "..$", "00")) %>% 
  filter(Rpt_Street_Pfx=="E")

#   For blocks west of Heights
Counter_w <- tibble(Block=(40:1)*100) %>% mutate(Counter=row_number()) %>% 
  mutate(Prefix="W")
#   For blocks east of Heights
Counter_e <- tibble(Block=(1:11)*100) %>% mutate(Counter=row_number()+40) %>% 
  mutate(Prefix="E")
Counter <- rbind(Counter_w, Counter_e) %>% mutate(Block=as.character(Block)) %>% 
  mutate(Counter=factor(as.character(Counter), levels=(as.character(Counter))))

keep <- Eleventh

Eleventh <- Eleventh %>% 
  mutate(Rpt_Block_Num=stringr::str_replace(Rpt_Block_Num, "..$", "00")) %>% 
  inner_join(., Counter, join_by(Rpt_Block_Num==Block, Rpt_Street_Pfx==Prefix))
  
saveRDS(Eleventh, "Eleventh_data.rds")

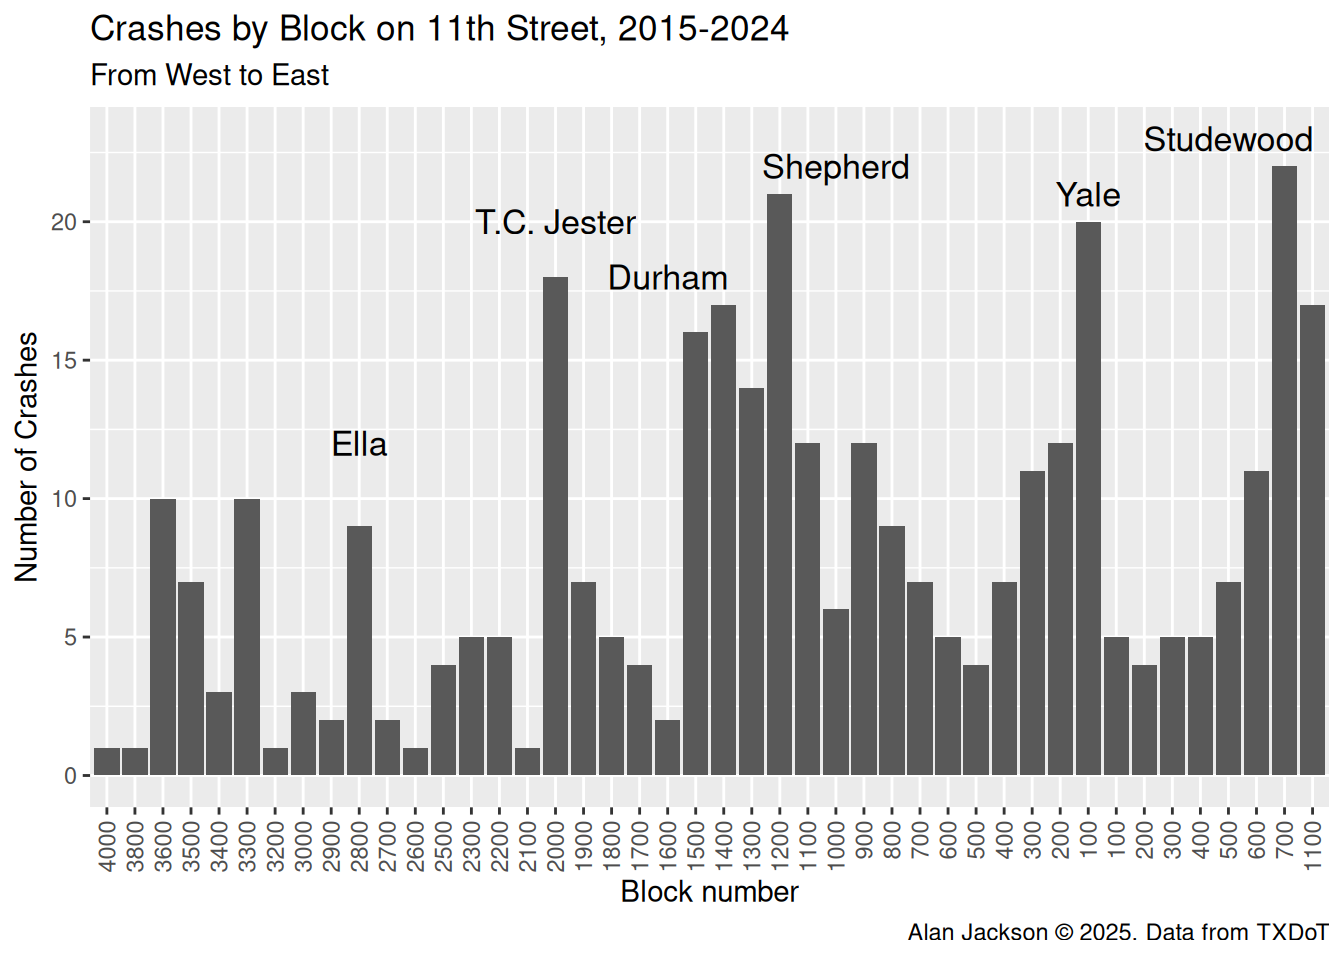
Let’s plot the data from west to east

It clear from this plot why the eastern half of 11th was targeted for traffic calming. A significant number of crashes in that portion of the steet. The part west of Shepherd is a boulevard - which may be why it has seen significantly fewer crashes.

Code
Eleventh %>% 
ggplot(aes(x=Counter))+
  geom_bar() +
  scale_x_discrete(
    breaks=Counter$Counter,
    labels=Counter$Block
  ) +
  theme(axis.text.x = element_text(angle = 90, vjust = 0.5, hjust=1)) +
   annotate('text', x = 10, y = 12, label = 'Ella', size = 4.5 ) +
   annotate('text', x = 17, y = 20, label = 'T.C. Jester', size = 4.5 ) +
   annotate('text', x = 21, y = 18, label = 'Durham', size = 4.5) +
   # annotate('text', x = 23, y = 20, label = 'Durham', size = 4.5 , angle=75) +
   annotate('text', x = 27, y = 22, label = 'Shepherd', size = 4.5 ) +
   annotate('text', x = 36, y = 21, label = 'Yale', size = 4.5 ) +
   annotate('text', x = 41, y = 23, label = 'Studewood', size = 4.5 ) +
  labs(title="Crashes by Block on 11th Street, 2015-2024",
       subtitle="From West to East",
       x="Block number",
       y="Number of Crashes",
       caption="Alan Jackson © 2025. Data from TXDoT")

Let’s look at the same data in 2-year chunks

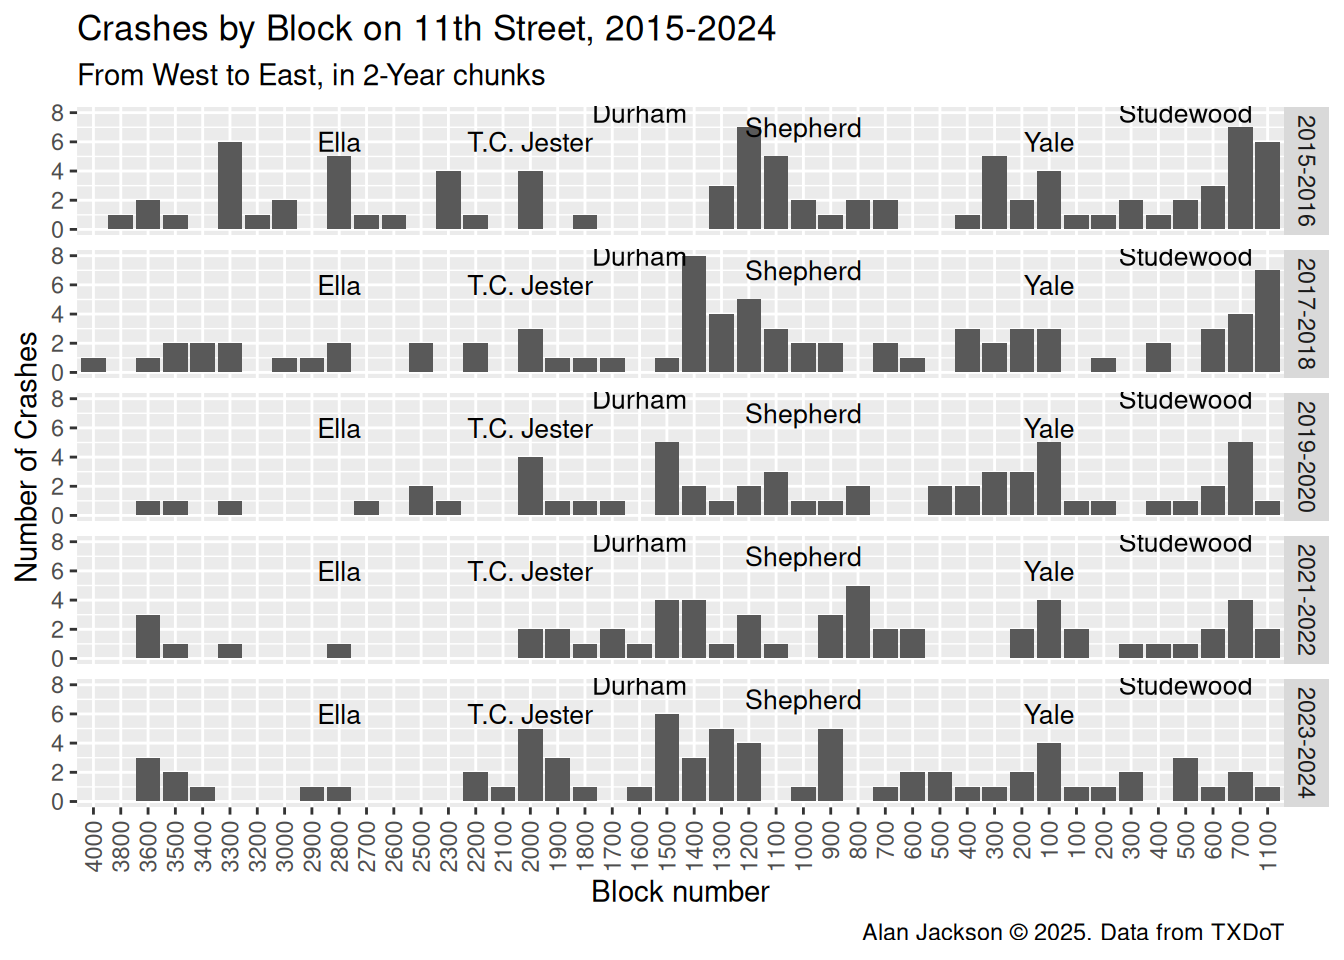
It seems pretty clear that the number of crashes east of Shepherd - the part of 11th that was “calmed” - has seen fewer crashes than it was seeing historically.

Code
Eleventh %>% 
  mutate(Years=case_when(
    Date %within% interval(ymd("2015/1/1"), ymd("2016/12/31")) ~ "2015-2016",
    Date %within% interval(ymd("2017/1/1"), ymd("2018/12/31")) ~ "2017-2018",
    Date %within% interval(ymd("2019/1/1"), ymd("2020/12/31")) ~ "2019-2020",
    Date %within% interval(ymd("2021/1/1"), ymd("2022/12/31")) ~ "2021-2022",
    Date %within% interval(ymd("2023/1/1"), ymd("2024/12/31")) ~ "2023-2024"
  )) %>% 
  mutate(Years=factor(Years, levels=c("2015-2016", "2017-2018", "2019-2020",
                                      "2021-2022", "2023-2024"))) %>% 
  ggplot(aes(x=Counter)) +
  geom_bar() +
  facet_grid(rows=vars(Years)) +
  scale_x_discrete(
    breaks=Counter$Counter,
    labels=Counter$Block
  ) +
  theme(axis.text.x = element_text(angle = 90, vjust = 0.5, hjust=1)) +
   annotate('text', x = 10, y = 6, label = 'Ella', size = 3.5 ) +
   annotate('text', x = 17, y = 6, label = 'T.C. Jester', size = 3.5 ) +
   annotate('text', x = 21, y = 8, label = 'Durham', size = 3.5) +
   annotate('text', x = 27, y = 7, label = 'Shepherd', size = 3.5 ) +
   annotate('text', x = 36, y = 6, label = 'Yale', size = 3.5 ) +
   annotate('text', x = 41, y = 8, label = 'Studewood', size = 3.5 ) +
  labs(title="Crashes by Block on 11th Street, 2015-2024",
       subtitle="From West to East, in 2-Year chunks",
       x="Block number",
       y="Number of Crashes",
       caption="Alan Jackson © 2025. Data from TXDoT")

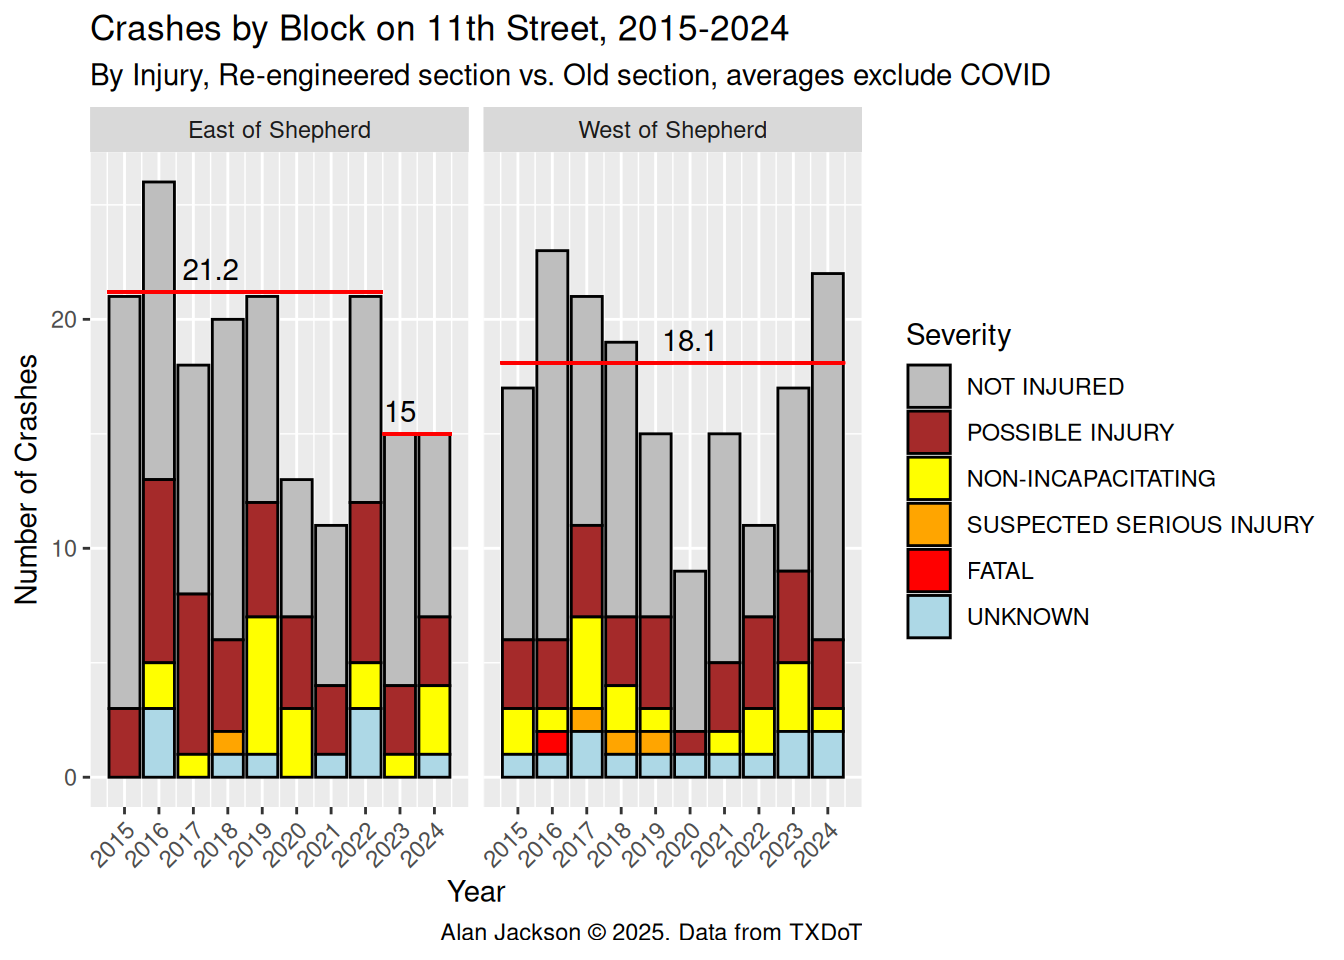
Let’s look at the sum of crashes per year, colored by injury

It is pretty clear that in the “calmed” portion of 11th the number of crashes has declined, but more inportantly, the number of crashes resulting in injuries has dropped - almost certainly a result of lower impact speeds. We do not see a similar decline west of Shepherd.

Code
#   Get averages for various periods

foo <- Eleventh %>% 
  mutate(Year=year(Date)) %>% 
  mutate(Calm=if_else(Calm, "East of Shepherd", "West of Shepherd")) %>% 
  filter(!between(Year, 2020, 2021)) # drop COVID years

Calm_old <- foo %>% 
  filter(Year<2023) %>% 
  filter(Calm=="East of Shepherd") %>% 
  group_by(Year) %>% 
    summarize(Crashes=n())

Calm_new <- foo %>% 
  filter(Year>2022) %>% 
  filter(Calm=="East of Shepherd") %>% 
  group_by(Year) %>% 
    summarize(Crashes=n())

UnCalm <- foo %>% 
  filter(Calm=="West of Shepherd") %>% 
  group_by(Year) %>% 
    summarize(Crashes=n())

# Lines <- tribble(
#   ~Calm,            ~Year, ~End_yr, ~Crashes,
#   "East of Shepherd", 2015,   2022,   signif(mean(Calm_old$Crashes),3),
#   "East of Shepherd", 2023,   2024,   signif(mean(Calm_new$Crashes),3),
#   "West of Shepherd", 2015,   2024,   signif(mean(UnCalm$Crashes),3)
#   )

Lines <- tibble(Calm=c(rep("East of Shepherd", 10), 
                       rep("West of Shepherd", 10)),
                Year=c(2015:2021, 2022:2024, 2015:2024),
                Crashes=c(rep(signif(mean(Calm_old$Crashes),3), 8),
                          rep(signif(mean(Calm_new$Crashes),3), 2),
                          rep(signif(mean(UnCalm$Crashes),3), 10))
               )

Ann_text <- tibble(Calm=c(rep("East of Shepherd", 2), 
                       rep("West of Shepherd", 1)),
                Year=c(2017.5, 2023, 2020),
                Crashes=c(signif(mean(Calm_old$Crashes),3),
                          signif(mean(Calm_new$Crashes),3),
                          signif(mean(UnCalm$Crashes),3))
               )

Eleventh %>% 
  mutate(Year=year(Date)) %>% 
  mutate(Calm=if_else(Calm, "East of Shepherd", "West of Shepherd")) %>% 
  full_join(., Lines, join_by(Calm, Year)) %>% 
  # mutate(Year=factor(Year, levels=2015:2024)) %>% 
  ggplot(aes(x=Year)) +
  geom_bar(color="black", stat="count", aes(fill=Severity)) +
  scale_fill_manual(values=c('NOT INJURED'="gray", 
                              'UNKNOWN'="lightblue",
                              'POSSIBLE INJURY'="brown",
                              'NON-INCAPACITATING'="yellow",
                              'FATAL'="red", 
                              'SUSPECTED SERIOUS INJURY'="orange")) + 
  theme(axis.text.x = element_text(angle=45, vjust=1, hjust=1))+
  scale_x_continuous(breaks = 2015:2024) +
  geom_segment(aes(x = Year-0.5, y = Crashes, xend=Year+0.5), color = "red") +
  geom_text(data=Ann_text, aes(label=Crashes, x=Year, y=Crashes+1)) +
  facet_grid(cols=vars(Calm)) +
  labs(title="Crashes by Block on 11th Street, 2015-2024",
       subtitle="By Injury, Re-engineered section vs. Old section, averages exclude COVID",
       x="Year",
       y="Number of Crashes",
       caption="Alan Jackson © 2025. Data from TXDoT")

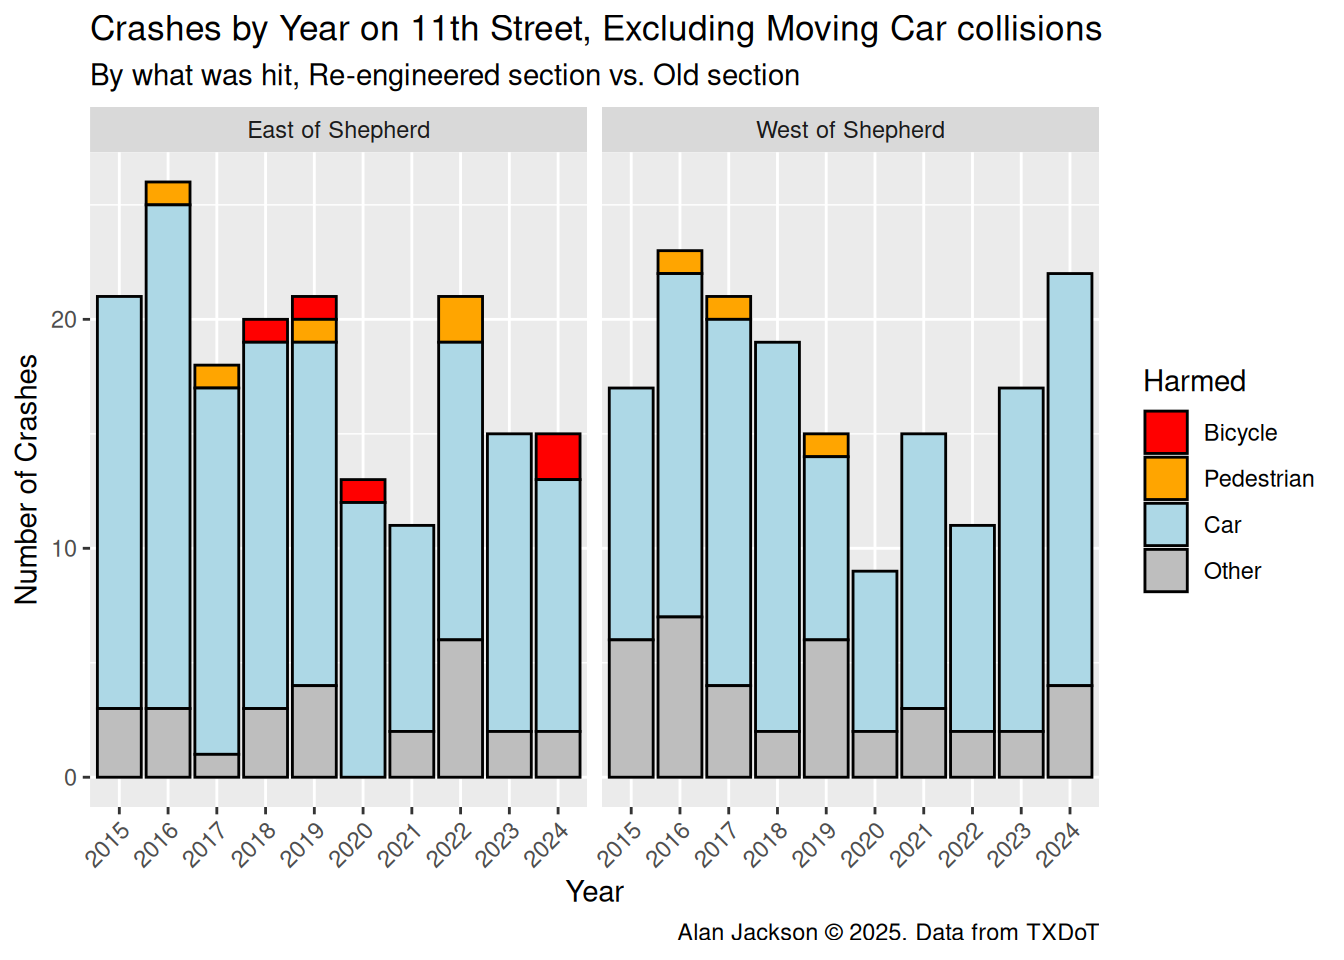
Let’s look at the sum of crashes per year, colored by harm

It is pretty clear that in the “calmed” portion of 11th the number of crashes has declined, but more inportantly, the number of crashes resulting in injuries has dropped - almost certainly a result of lower impact speeds. We do not see a similar decline west of Shepherd. Note that 2020 and 2021 were the COVID years.

Code
Eleventh %>% 
  mutate(Year=year(Date)) %>% 
  mutate(Year=factor(Year, levels=2015:2024)) %>% 
  mutate(Harmed=case_when(
    Harmed=="Motor Vehicle in Transport" ~ "Car",
    Harmed=="Parked Car" ~ "Other",
    Harmed=="Fixed Object" ~ "Other",
    Harmed=="Rail Road" ~ "Other",
    Harmed=="Other Object" ~ "Other",
    Harmed=="Other Non-Collision" ~ "Other",
    Harmed=="Overturned" ~ "Other",
    Harmed=="Pedestrian" ~ "Pedestrian",
    Harmed=="Pedal Cyclist" ~ "Bicycle"
  )) %>% 
    mutate(Harmed=factor(Harmed, levels=c("Bicycle",
                                          "Pedestrian", 
                                          "Car", "Other"
                                          ))) %>% 
  mutate(Calm=if_else(Calm, "East of Shepherd", "West of Shepherd")) %>% 
  ggplot(aes(x=Year, fill=Harmed)) +
  geom_bar(color="black", stat="count") +
  scale_fill_manual(values=c('Other'="gray", 
                              'Car'="lightblue",
                              'Bicycle'="red", 
                              'Pedestrian'="orange")) + 
  theme(axis.text.x = element_text(angle=45, vjust=1, hjust=1))+
  facet_grid(cols=vars(Calm)) +
  labs(title="Crashes by Year on 11th Street, Excluding Moving Car collisions",
       subtitle="By what was hit, Re-engineered section vs. Old section",
       x="Year",
       y="Number of Crashes",
       caption="Alan Jackson © 2025. Data from TXDoT")

Let’s look at all the Pedestrian and Bicycle injuries

There are really too few to make any meaningful statistical statement.

However, note too that statistically, intersections are the most dangerous locations, and almost all of these occured near or at intersections.

Code
Eleventh %>% 
  mutate(Year=year(Date)) %>% 
  mutate(Year=factor(Year, levels=2015:2024)) %>% 
  mutate(Calm=if_else(Calm, "East of Shepherd", "West of Shepherd")) %>% 
  filter(Severity!="UNKNOWN") %>% 
  filter(stringr::str_detect(Harmed, "Pedestrian|Pedal Cyclist")) %>% 
  select(Date, Harmed, Severity, Tot_Injry_Cnt, At_Intrsct_Fl, Calm, Rpt_Block_Num) %>% 
  arrange(Date) %>% 
  gt() %>% 
  cols_label(
    Date="Date",
    Rpt_Block_Num="Block",
    At_Intrsct_Fl="Intrsect?",
    Calm="Segment",
    Tot_Injry_Cnt="# Injured?",
    Severity="Severity",
    Harmed="Harmed"
  ) %>% 
  fmt_datetime(
    Date,
    time_style="Hm"
  ) %>% 
  gt_highlight_rows(
    rows=c(1,2,3,7,8,10,11,12,13)
  ) %>% 
  tab_footnote(
    html("Highlighted rows are locations near or at a major intersection or the
    MKT trail crossing<br> Alan Jackson © 2025. Data from TXDoT")
  ) %>% 
  tab_header(
    title="Crashes With People or Bicycles on 11th Street",
    subtitle="Years 2015-2024"
  )
Crashes With People or Bicycles on 11th Street
Years 2015-2024
Date Harmed Severity # Injured? Intrsect? Segment Block
2016-10-25 17:56 Pedestrian NOT INJURED 0 Y East of Shepherd 700
2016-11-23 15:45 Pedestrian POSSIBLE INJURY 1 Y West of Shepherd 2000
2017-07-05 22:40 Pedestrian NON-INCAPACITATING 1 Y East of Shepherd 100
2017-11-02 07:10 Pedestrian POSSIBLE INJURY 1 N West of Shepherd 1400
2018-10-05 15:56 Pedal Cyclist POSSIBLE INJURY 1 N East of Shepherd 1000
2019-05-29 16:18 Pedal Cyclist NON-INCAPACITATING 1 N East of Shepherd 1100
2019-05-30 09:27 Pedestrian SUSPECTED SERIOUS INJURY 1 Y West of Shepherd 1500
2019-09-20 08:50 Pedestrian NON-INCAPACITATING 1 Y East of Shepherd 500
2020-12-23 17:10 Pedal Cyclist POSSIBLE INJURY 1 N East of Shepherd 500
2022-07-19 18:00 Pedestrian NON-INCAPACITATING 1 Y East of Shepherd 800
2022-09-14 18:45 Pedestrian POSSIBLE INJURY 1 Y East of Shepherd 800
2024-06-06 13:14 Pedal Cyclist NOT INJURED 0 Y East of Shepherd 200
2024-10-07 16:25 Pedal Cyclist NON-INCAPACITATING 2 Y East of Shepherd 100
Highlighted rows are locations near or at a major intersection or the MKT trail crossing
Alan Jackson © 2025. Data from TXDoT

Conclusions

From this data, it appears that the main goal of the re-engineering - traffic calming to reduce crashes and reduce the impact of crashes - was largely successful.

Excluding the COVID years, West of Shepherd saw an average of 18.1 crashes per year in the 2015-2024 period. East of Shepherd - again excluding COVID years - crashes declined from 21.2 per year to 15.0 per year, a decline of 30%.

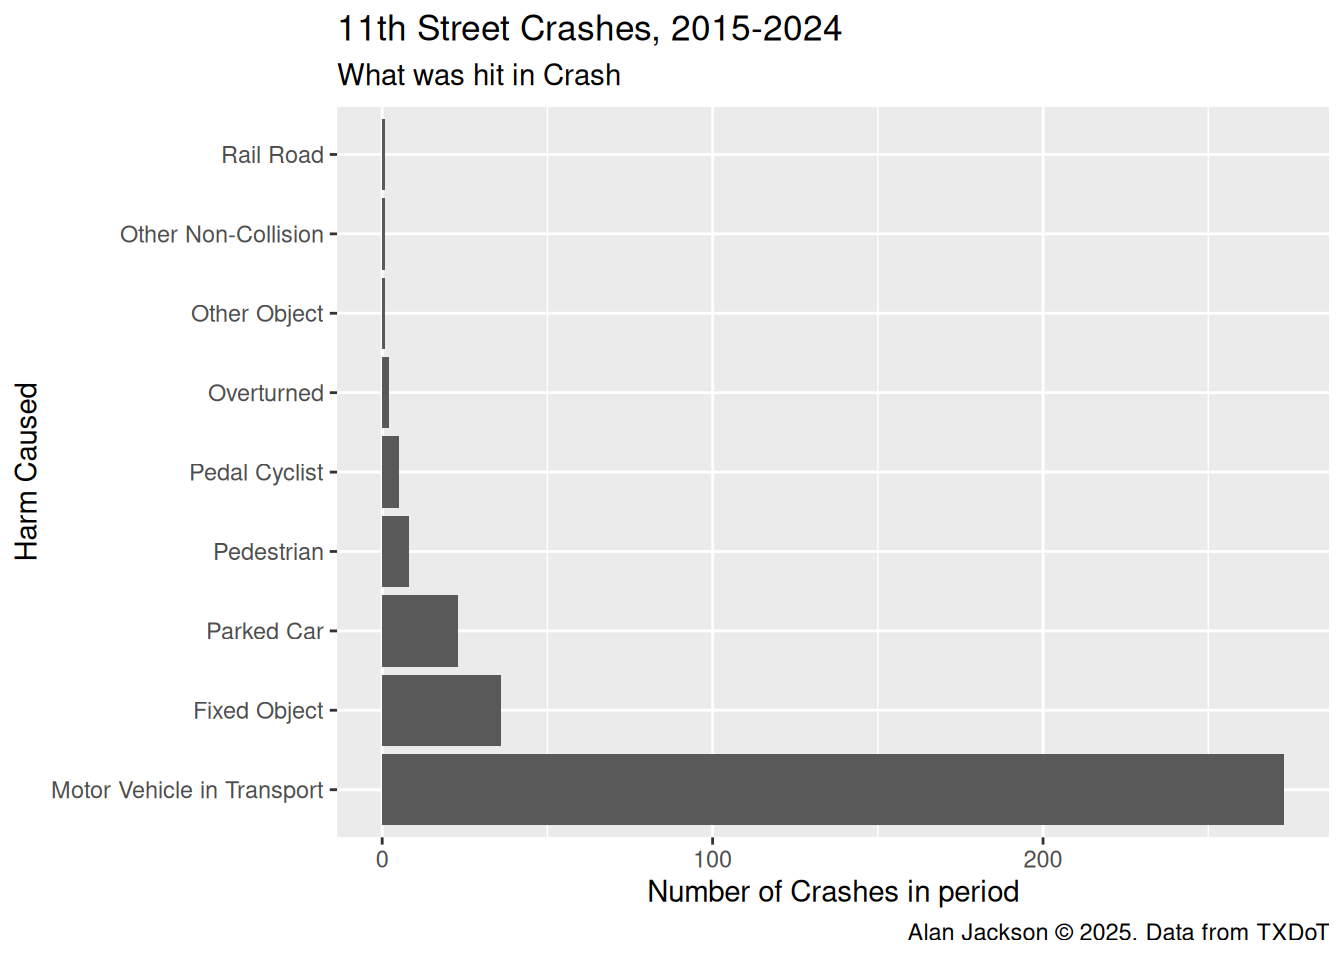
The data on bicyclists and pedestrians is too sparse for a meaningful statistical analysis, but it does hint at injuries becoming less severe. In any event, it is notable that almost all the collisions with bicycles or pedestrians resulted in injuries, highlighting the unequal nature of the interaction.