Read in the Census Bureau Community Resilience Estimates
Author
Alan Jackson
Published
April 27, 2025
Data downloaded from https://www.census.gov/programs-surveys/community-resilience-estimates/data/datasets.html
Many thanks to Katherine Ann Willyard for sharing a copy of her paper “Developing a Data-Driven System for Identifying Vulnerable Neighborhoods” which explained quite clearly why this is a superior vulnerability measure, from a purely statistical viewpoint.
Variable
Description
GEO_ID
A geographic identifier on the type of geography and applicable FIPS codes
STATE
State FIPS code
COUNTY
County FIPS code*
TRACT
Tract FIPS code*
NAME
Geographic Area Name
GEO_LEVEL
Geographic level*
WATER_TRACT
Flag that denotes tracts composed completely of water, where no populations reside*
POPUNI
Total population (excludes adult correctional/juvenile facilities and college dorms)
PRED0_E
Estimated number of individuals with zero components of social vulnerability
PRED0_M
Estimated margin of error
PRED0_PE
Rate of individuals with zero components of social vulnerability
PRED0_PM
Rate margin of error
PRED12_E
Estimated number of individuals with one-two components of social vulnerability
PRED12_M
Estimated margin of error
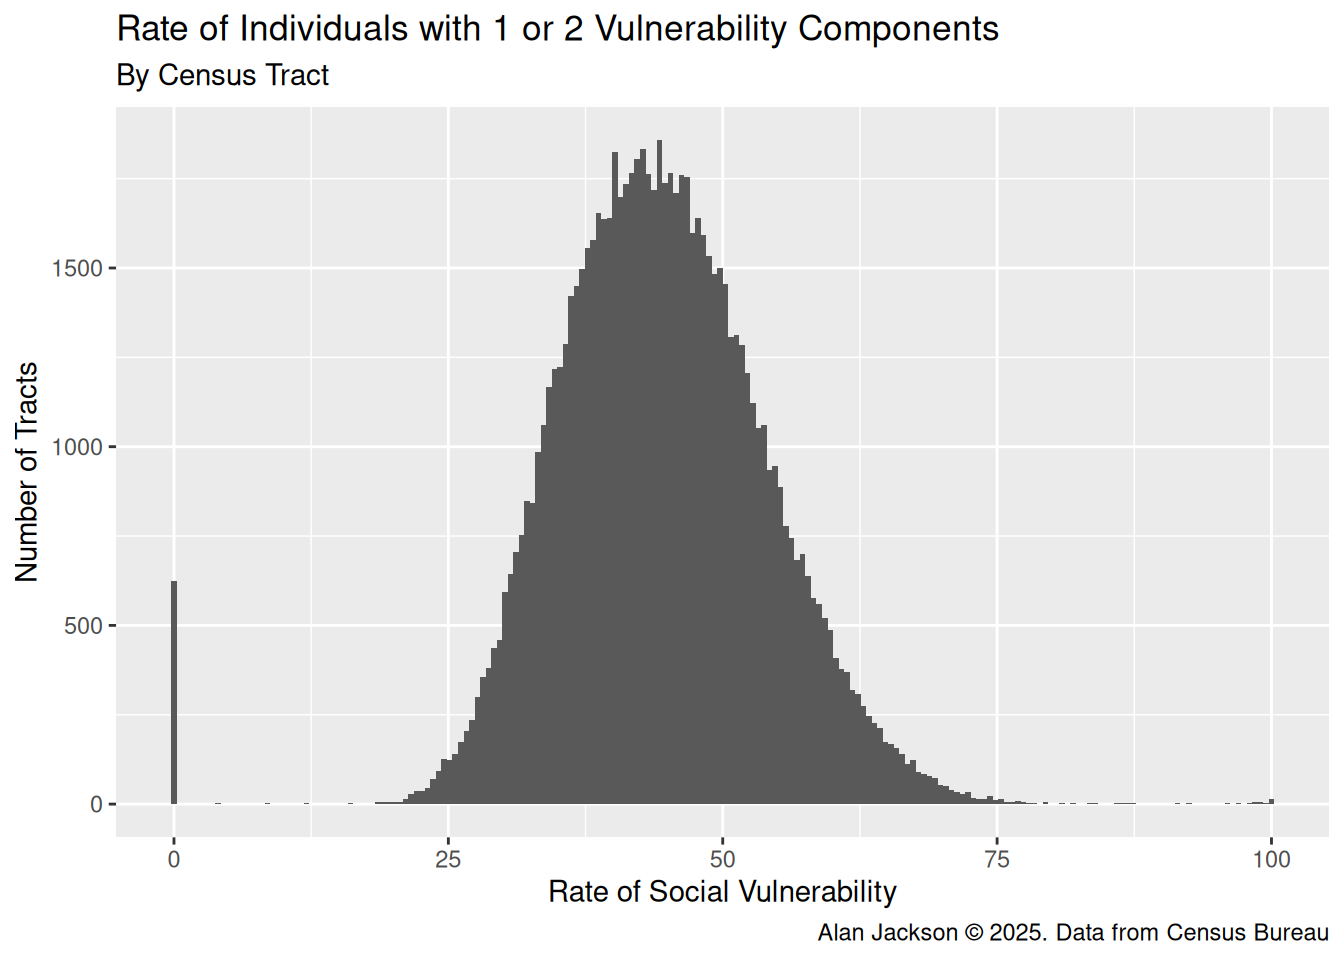
PRED12_PE
Rate of individuals with one-two components of social vulnerability
PRED12_PM
Rate margin of error
PRED3_E
Estimated number of individuals with three plus components of social vulnerability
PRED3_M
Estimated margin of error
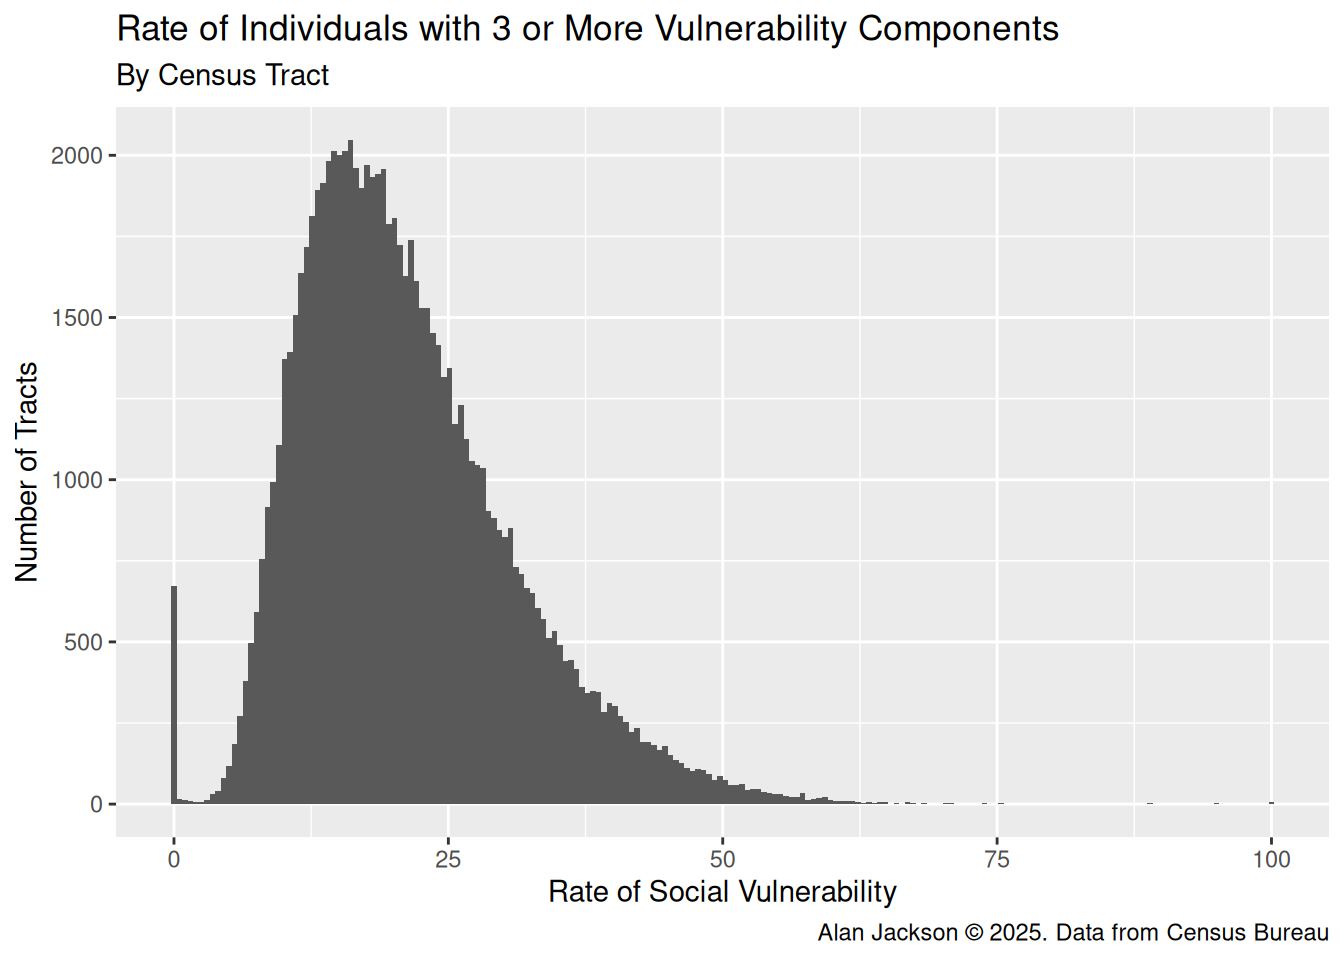
PRED3_PE
Rate of individuals with three plus components of social vulnerability
PRED3_PM
Rate margin of error
How is Vulnerability calculated?
The following ten vulnerability indicators are used in the CRE:
Households with an income-to-poverty ratio less than 130 percent
Only one or no individuals living in the household are aged 18-64
Household crowding defined as more than 0.75 persons per room
Household with a communication barrier defined as either limited English-speaking households or households where no one over the age of 16 has a high school diploma
No one in the household is employed full-time, year-round, but the flag is not applied if all residents of the household are aged 65 or older
Individual with a disability posing a constraint to significant life activity,
Attach geometry to the tracts so we can later make a map. Just look at tracts with a P3 ratio > 20, and more than 300 people in P3 in Louisiana.
Code
# get table of state codes and state abbreviations from tidycensusdata(fips_codes)# force(fips_codes)df_map <-NULL# Pull out tracts of interestfoo <- df %>%filter(PRED3_E>300& PRED3_PE>20) # Attach state abbreviations to data framefoo <-as_tibble_col(unique(foo$STATE), column_name ="STATE") %>%inner_join(., fips_codes %>%filter(county_code=="001"), join_by(STATE==state_code)) %>%select(STATE, state) %>%left_join(foo, ., by="STATE")# Attach geometryCensus <-readRDS(paste0(path, "Census_Tracts_2023/All_ACS_2023.rds"))foo2 <- foo %>%mutate(GEOID=str_remove(GEO_ID, "^\\d*US")) %>%inner_join(., Census, by="GEOID") %>% sf::st_as_sf()tmap::tmap_options(basemap.server="OpenStreetMap")tmap::tmap_mode("view") # set mode to interactive plots# tmap mode set to interactive viewing tmap::tm_shape(foo2 %>%filter(state=="LA")) + tmap::tm_polygons(size=0.5, fill="PRED3_PE", fill_alpha=0.4)
Conclusions
This should be a more robust and more useful vulnerability measure than simply using income or poverty levels. It is a bit of a shame that the numbers for the individual components are not broken out, but I expect that could raise privacy issues. Similarly, it would be nice if it were available at the block-group level, but again, that might raise privacy issues.